


- Gold prices rebounding off key support zone- bearish invalidation at 1489 heading into FOMC
- Check out our 2019 projections in our Free DailyFX Gold Trading Forecasts
- Join Michael for Live Weekly Strategy Webinars on Mondays at 12:30GMT
Gold prices are carving out a well-defined December opening-range just above key long-term support and the stage is set heading into today’s FOMC interest rate decision. These are the updated targets and invalidation levels that matter on the XAU/USD charts. Review my latest Weekly Strategy Webinar for an in-depth breakdown of this gold price setup and more.
New to Gold Trading? Get started with this Free How to Trade Gold -Beginners Guide
Gold Price Chart - XAU/USD Daily
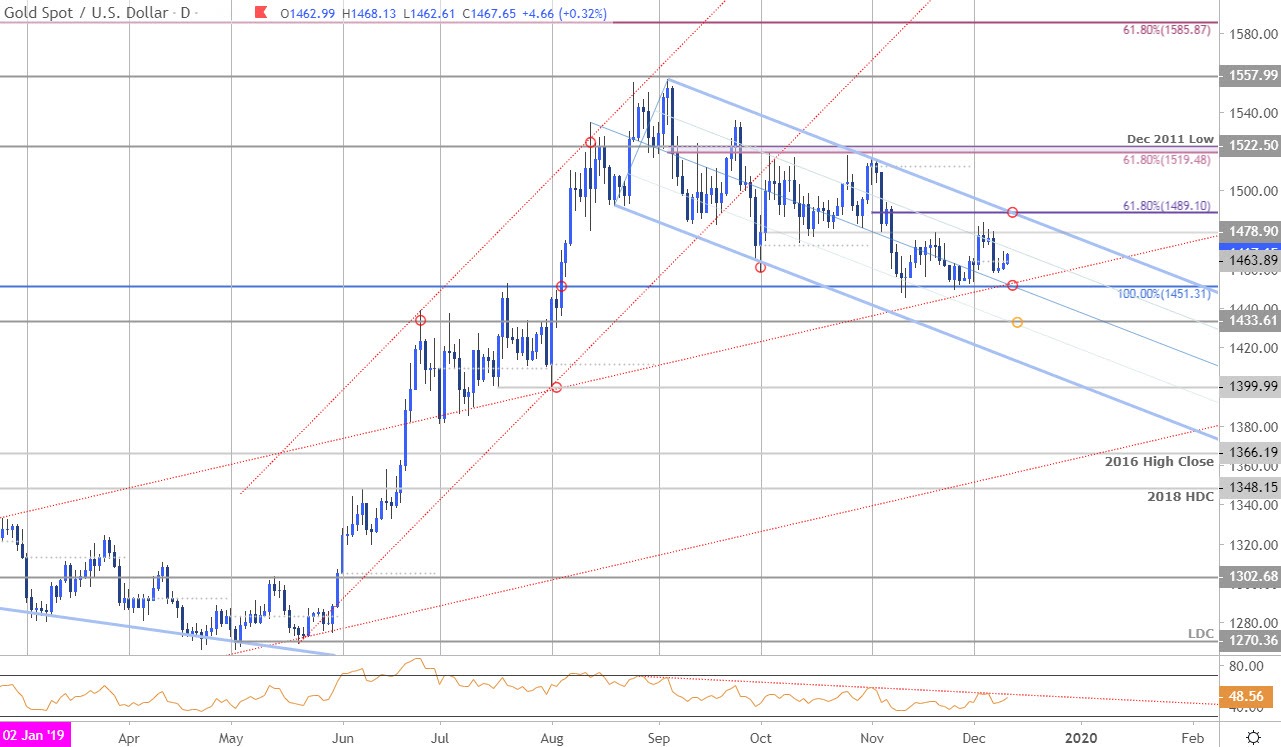
Chart Prepared by Michael Boutros, Technical Strategist; Gold on Tradingview
Technical Outlook: In my latest Gold Price Outlook we noted that XAU/USD had continued trade within a long-term support zone at, “the 1451-1461 range with the short-bias vulnerable while above the monthly (November) opening-range lows.” Nearly two weeks later and price has continued to hold above this threshold with the December opening-range taking shape just above.
Critical daily support steady at the 1451 confluence zone- a break / close below this threshold would is needed to keep the short-bias viable with such a scenario exposing August 2013 swing high / 25% parallel at 1433. Initial resistance stands at the October low-day close at 1479 backed by the upper parallel / 61.8% retracement at 1489 – a close above this threshold would validate a breakout and shift the focus back t the long-side in gold.
Gold Price Chart - XAU/USD 120min
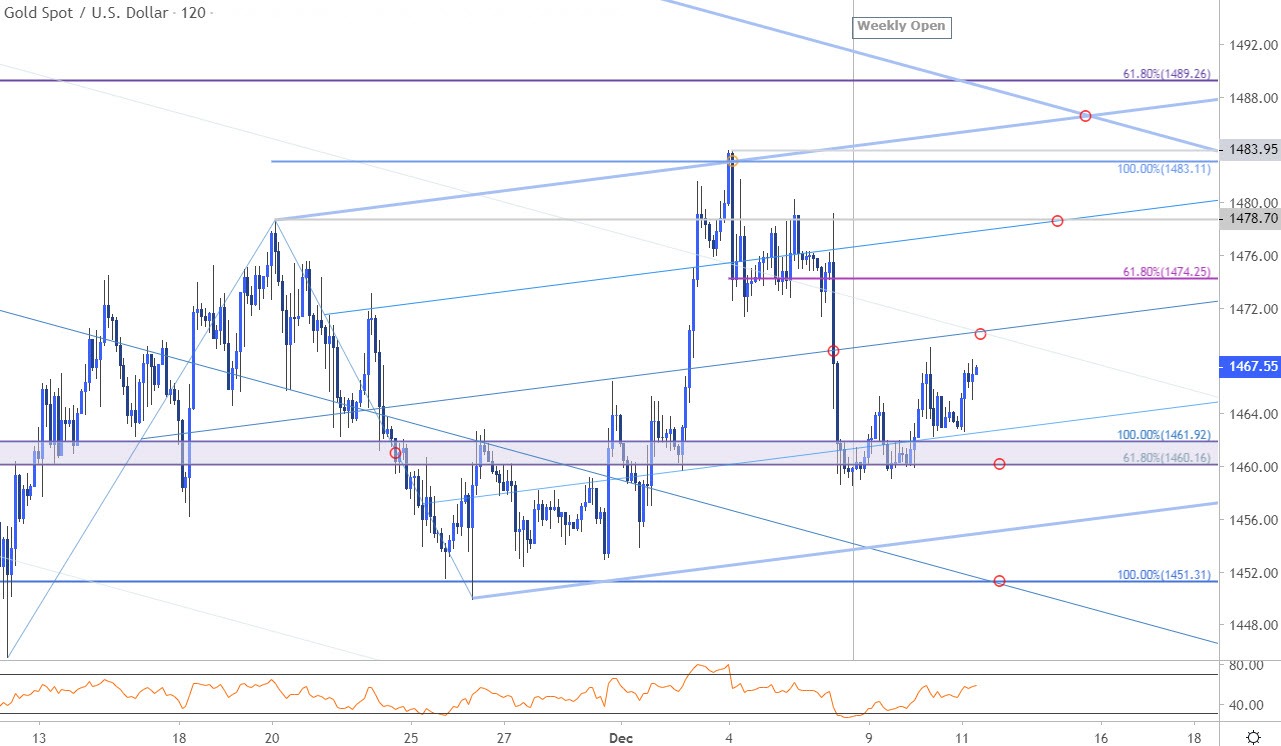
Notes: A closer look at gold price action shows XAU/USD trading within the confines an a modified ascending pitchfork formation extending off the November lows with bullion looking to challenge the median-line ahead of today’s FOMC interest rate decision. A breach above the highlighted trendline confluence (near ~1470) would expose a larger recovery towards 1474 and the late-Novembers swing high / 75% parallel at 1478. Subsequent resistance objectives are stacked up just higher at 1483 and the highlighted slope confluence around 1486 – Ultimately, a breach / close above 1489 is needed to suggest a more significant low was registered last month.
Initial support rests at 1460/61 with a break below the weekly range lows exposing the lower parallel – look for a reaction there IF reached. At the end of the day, weakness beyond 1451 would risk another leg lower in gold prices targeting 1433.
Why does the average trader lose? Avoid these Mistakes in your trading
Bottom line: Gold prices are rebounding off long-term support here and the immediate focus on this recovery. From a trading standpoint, we’ll favor fading weakness while within this formation with a breach above 1489 needed to validate a breakout of the multi-month downtrend. Use caution heading into today’s Fed interest rate decision- IF fails on stretch higher here, a break beyond 1451 could see things accelerate quickly. Review my latest Gold Price Weekly Outlook for a closer look at the longer-term XAU/USD technical trading levels.
For a complete breakdown of Michael’s trading strategy, review his Foundations of Technical Analysis series on Building a Trading Strategy
Gold Trader Sentiment – XAU/USD Price Chart
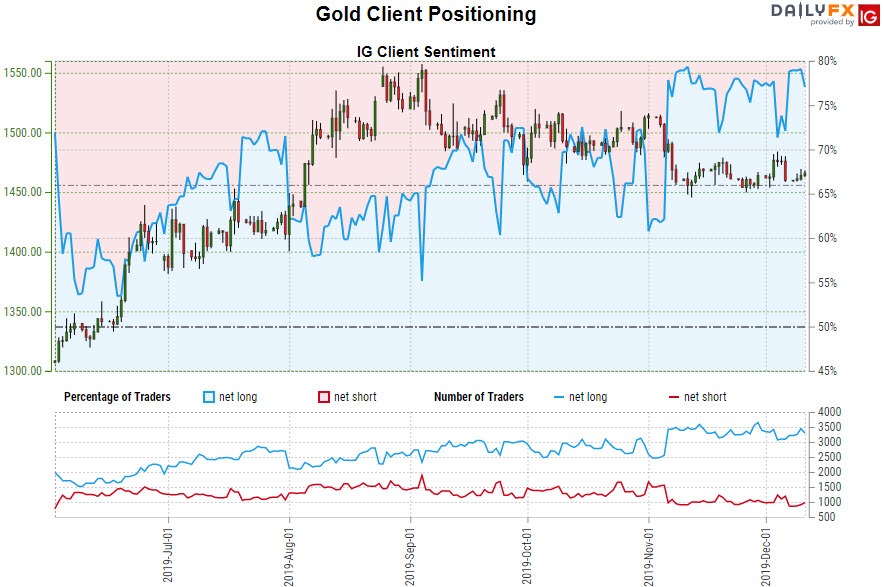
- A summary of IG Client Sentiment shows traders are net-long Gold- the ratio stands at +2.98 (74.90% of traders are long) – bearishreading
- Long positions are5.76% lower than yesterday and 7.52% higher from last week
- Short positions are 14.83% higher than yesterday and 6.75% lower from last week
- We typically take a contrarian view to crowd sentiment, and the fact traders are net-long suggests Gold prices may continue to fall. Traders are less net-long than yesterday but more net-long from last week and the combination of current positioning and recent changes gives us a further mixed Gold trading bias from a sentiment standpoint.
| Change in | Longs | Shorts | OI |
| Daily | 1% | -3% | -1% |
| Weekly | 2% | -8% | -2% |
---
Active Trade Setups
- Euro Price Outlook: EUR/USD Battle Lines Drawn ahead of FOMC
- Canadian Dollar Outlook: USD/CAD Bulls at Risk – Loonie Trade Levels
- Australian Dollar Price Outlook: Aussie Challenges Key Technical Support
- US Dollar Price Outlook: USD Recovery Trade – DXY Trade Levels
- Written by Michael Boutros, Currency Strategist with DailyFX
Follow Michael on Twitter @MBForex


