


Crude Oil Technical Forecast: WTI Weekly Trade Levels
- Crude Oil updated technical trade levels – Weekly Chart
- WTI snaps six-week winning streak- weekly reversal off key resistance in focus
- New to Oil Trading? Get started with this Free How to Trade Oil-Beginners Guide
Oil prices are poised to snap a six-week winning streak as a major breakout in WTI responds to key technical resistance. While the broader outlook remains constructive, this week’s reversal threatens a deeper correction in the days ahead and leaves the bulls vulnerable while below 77.37 near-term. These are the updated targets and invalidation levels that matter on the oil price weekly chart. Review my latest Strategy Webinar for an in-depth breakdown of this crude oil price technical setup and more.
Crude Oil Price Chart – WTI Weekly

Chart Prepared by Michael Boutros, Technical Strategist; Crude Oil (WTI) on Tradingview
Notes: In my last Crude Oil Price Forecast (May) we noted that WTI was, “testing key resistance here at 65.92-66.26 – a region defined by the August 2018 low-week close (LWC) and the 2021 high-close (HC).” This region capped oil prices for nearly four-weeks before a breakout into the June open fueled an advance of more than 34% off the March lows. That rally is now testing a critical weekly resistance confluence at 2011/2012 lows / 100% extension at 74.94-77.37- price registered an intraweek high at 76.95 before reversing sharply this week. Is a near-term high in place?
Initial weekly support rests with the median-line of the ascending pitchfork extending off the November / April lows with broader bullish invalidation now raised to the lower parallel / 2019 high at 65.92-66.57. That means that even if crude prices corrected another 10% from here, it would still be within the confines of this broader uptrend. Ultimately, a topside breach / close above the upper parallel is needed to mark resumption of the broader uptrend with such a scenario likely to fuel another acerated run towards the 2011 low-week close at 82.84 and the longer-term slope confluence near 87.80s.

Bottom line: A six-week advance has taken oil prices into a long-term technical confluence – we’re looking for possible inflection off this key zone at 74.94-77.26. From a trading standpoint, a good zone to reduce long-exposure / raise protective stops. Be on the lookout for a break of the July opening-range (basically this week’s range) for guidance - Losses should be limited by the lower parallel IF price is indeed heading higher with a topside breach exposing fresh multi-year highs. I’ll publish an updated Crude Oil Price Outlook once we get further clarity on the near-term WTI technical trade levels.
For a complete breakdown of Michael’s trading strategy, review his Foundations of Technical Analysis series on Building a Trading Strategy
Crude Oil Trader Sentiment – WTI Price Chart
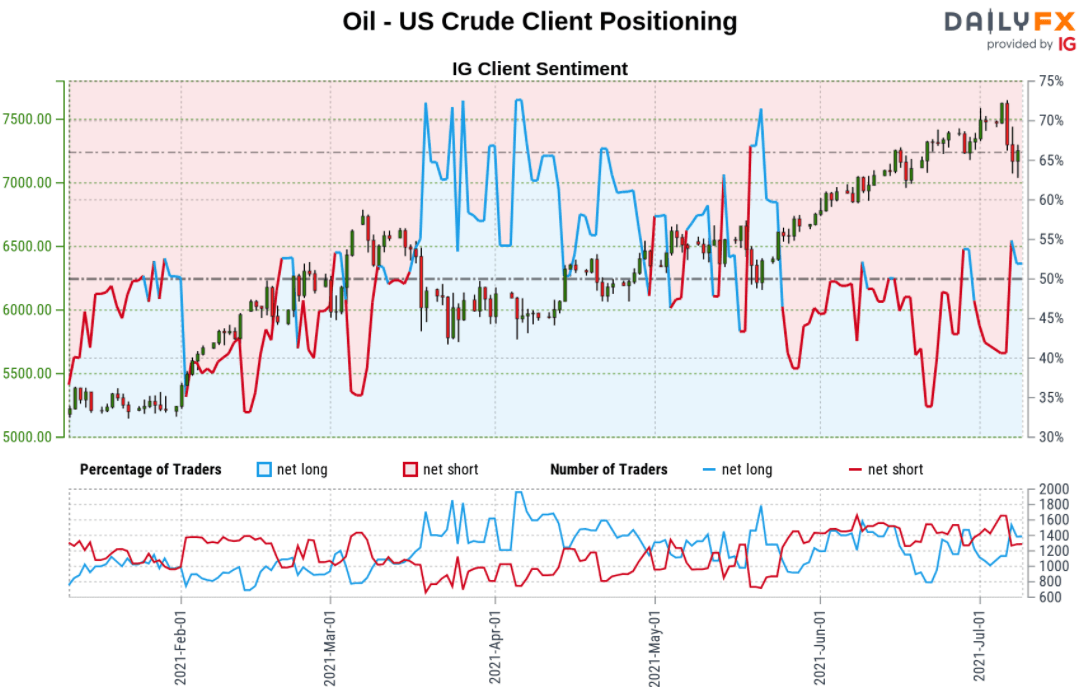
- A summary of IG Client Sentiment shows traders are net-long crude oil - the ratio stands at +1.16 (53.68% of traders are long) – typically weak bearish reading
- Long positions are 1.62% lower than yesterday and 24.42% higher from last week
- Short positions are5.70% lower than yesterday and 16.64% lower from last week
- We typically take a contrarian view to crowd sentiment, and the fact traders are net-long suggests Oil - US Crude prices may continue to fall. Traders are further net-long than yesterday and last week, and the combination of current positioning and recent changes gives us a stronger Oil - US Crude-bearish contrarian trading bias from a sentiment standpoint.
| Change in | Longs | Shorts | OI |
| Daily | 3% | -7% | 1% |
| Weekly | 31% | -38% | 7% |
---
Previous Weekly Technical Charts
- New Zealand Dollar (NZD/USD)
- Japanese Yen (USD/JPY)
- Gold (XAU/USD)
- Sterling (GBP/USD)
- Australian Dollar (AUD/USD)
- Canadian Dollar (USD/CAD)
- Euro (EUR/USD)
- US Dollar Index (DXY)

--- Written by Michael Boutros, Technical Strategist with DailyFX
Follow Michael on Twitter @MBForex


