


Australian Dollar Technical Price Outlook: AUD/USD Weekly Trade Levels
- Australian Dollar technical trade level update - Weekly Chart
- AUD/USD plummets though 2021 opening range- recovery vulnerable trend resistance
- Aussie critical support into 7385, key resistance / bearish invalidation at 7733
The Australian Dollar rallied more than 1.4% against the US Dollar since the start of the week with AUD/USD reversing just ahead of trend support into the weekly open. While a break of the yearly opening-range does tilt the medium-term outlook lower, the immediate focus is on possible exhaustion on this near-term recovery. These are the updated targets and invalidation levels that matter on the AUD/USD weekly price chart. Review my latest Weekly Strategy Webinar for an in-depth breakdown of this Aussie technical setup and more.
Australian Dollar Price Chart – AUD/USD Weekly
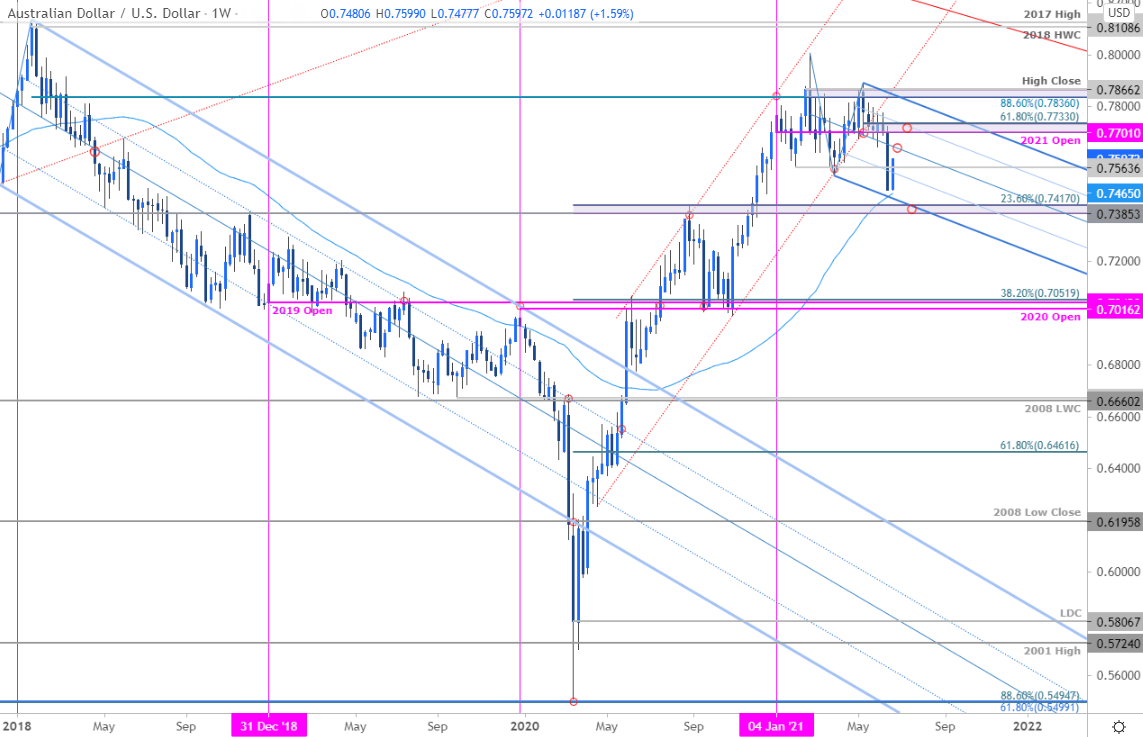
Chart Prepared by Michael Boutros, Technical Strategist; AUD/USD on Tradingview
Notes: In last month’s Australian Dollar Weekly Price Outlook we noted that AUD/USD had, “once again responded to weekly technical resistance and leaves the bulls vulnerable while below 7866. From a trading standpoint, look for inflection off yearly-open support for guidance – recoveries should be capped by 7800 IF price is indeed heading lower with a close below 7700 needed to suggest a more significant reversal is underway.” Aussie spent the following four-weeks consolidating just above this threshold before collapsing last week – the focus is on this near-term price recovery.
Initial resistance stands at the median-line (currently ~7640s) with bearish invalidation now lowered to the 2021 yearly open / 61.8% Fibonacci retracement of the May decline at 7701/33- both levels of interest for possible price exhaustion. Initial weekly support rests with the 52-week moving average at ~7465 backed by key support at the May 2017 low-week close / 23.6% retracement at 7385-7417 – look for a larger reaction there IF reached for guidance with a break / weekly close below needed to fuel the next leg lower in price.

Bottom line: The Australian Dollar has broken below yearly uptrend support with the broader risk weighted to the downside while within this formation. From a trading standpoint, look for topside exhaustion ahead 7733 IF price is indeed heading lower with close below 7385 risking another accelerated Aussie sell-off. Use caution into the close of the week with the US Core Personal Consumption Expenditure (PCE) on tap Friday. I’ll publish an updated Australian Dollar Price Outlook once we get further clarity on the near-term AUD/USD technical trade levels.
For a complete breakdown of Michael’s trading strategy, review his Foundations of Technical Analysis series on Building a Trading Strategy
Australian Dollar Trader Sentiment – AUD/USD Price Chart

- A summary of IG Client Sentiment shows traders are net-long AUD/USD - the ratio stands at +1.76 (63.81% of traders are long) – typically bearish reading
- Long positions are 1.64% higher than yesterday and 8.84% higher from last week
- Short positions are7.45% lower than yesterday and 19.52% lower from last week
- We typically take a contrarian view to crowd sentiment, and the fact traders are net-long suggests AUD/USD prices may continue to fall. Traders are further net-long than yesterday and last week, and the combination of current positioning and recent changes gives us a stronger AUD/USD-bearish contrarian trading bias from a sentiment standpoint.
| Change in | Longs | Shorts | OI |
| Daily | 2% | 3% | 2% |
| Weekly | 29% | -46% | 0% |
---
Key Australia / US Data Releases

Economic Calendar - latest economic developments and upcoming event risk.
Previous Weekly Technical Charts
- Canadian Dollar (USD/CAD)
- Euro (EUR/USD)
- US Dollar Index (DXY)
- Gold (XAU/USD)
- New Zealand Dollar (NZD/USD)
- Sterling (GBP/USD)
- Crude Oil (WTI)
- Japanese Yen (USD/JPY)
--- Written by Michael Boutros, Technical Currency Strategist with DailyFX
Follow Michael on Twitter @MBForex


