


Crude Oil Technical Forecast: WTI Weekly Trade Levels
- Crude Oil updated technical trade levels – Weekly Chart
- WTI rally grinds into resistance for a third week– looking for inflection into 66
- New to Oil Trading? Get started with this Free How to Trade Oil-Beginners Guide
Oil prices surged more than 17% off the March lows with a three-week rally now pressing technical resistance near the yearly highs. Despite a barrage of headlines regarding the Colonial Pipeline hack, disruptions in the gas supply chain and rising inflationary concerns, WTI has remained capped by a key technical resistance zone we’ve been tracking for months now. While the broader outlook remains constructive, the immediate advance may be vulnerable while below this threshold and we’re looking for possible price inflection in the days ahead to offer guidance. These are the updated targets and invalidation levels that matter on the oil price weekly chart. Review my latest Strategy Webinar for an in-depth breakdown of this crude oil price technical setup and more.
Crude Oil Price Chart – WTI Weekly
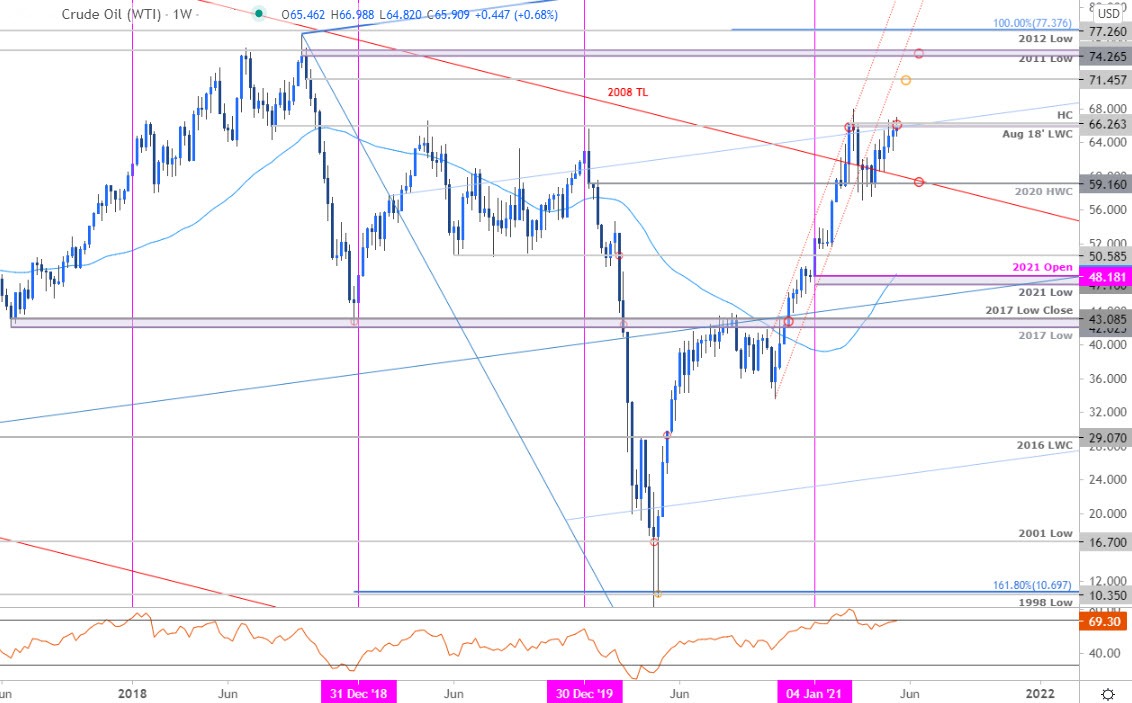
Chart Prepared by Michael Boutros, Technical Strategist; Crude Oil (WTI) on Tradingview
Notes: Oil prices are testing key resistance here at 65.92-66.26 – a region defined by the August 2018 low-week close (LWC) and the 2021 high-close (HC). This threshold has capped the last four attempts and continues to pose risk to the immediate advance. Monthly-open support rests at 63.45 backed by key support / broader bullish invalidation at the 2020 high-week reversal close at 59.16- look for a low ahead of this level IF price is indeed heading higher. A topside breach / close above this critical zone exposes subsequent topside resistance objectives at the yearly high 67.94, the October 2018 reversal close at 71.45 and the 2011 / 2012 lows at 74.26/94 – an area of interest for possible topside exhaustion IF reached.

Bottom line: The crude oil rally may be vulnerable in the days ahead as price extends into multi-year technical resistance. From at trading standpoint, a good zone to reduce long-exposure / raise protective stops – be on the lookout for possible topside exhaustion while below 66.26. Ultimately a pullback may offer more favorable opportunities closer to uptrend support with a breach of the highs clearing the way for the next leg higher towards 71.45 and beyond. Review my latest Crude Oil Price Outlook for a closer look at the near-term WTI technical trade levels.
For a complete breakdown of Michael’s trading strategy, review his Foundations of Technical Analysis series on Building a Trading Strategy
Crude Oil Trader Sentiment – WTI Price Chart

- A summary of IG Client Sentiment shows traders are net-short crude oil - the ratio stands at -1.24 (44.56% of traders are long) – typically weak bullish reading
- Long positions are 13.68% lower than yesterday and 25.98% lower from last week
- Short positions are13.87% higher than yesterday and 33.48% higher from last week
- We typically take a contrarian view to crowd sentiment, and the fact traders are net-short suggests Oil - US Crude prices may continue to rise. Traders are further net-short than yesterday and last week, and the combination of current sentiment and recent changes gives us a stronger Crude Oil-bullish contrarian trading bias from a sentiment standpoint.
| Change in | Longs | Shorts | OI |
| Daily | 6% | -8% | 2% |
| Weekly | 3% | -23% | -5% |
---
Previous Weekly Technical Charts
- Canadian Dollar (USD/CAD)
- Gold (XAU/USD)
- Australian Dollar (AUD/USD)
- US Dollar Index (DXY)
- Japanese Yen (USD/JPY)
- Sterling (GBP/USD)
- New Zealand Dollar (NZD/USD)

--- Written by Michael Boutros, Technical Strategist with DailyFX
Follow Michael on Twitter @MBForex


