


Gold Technical Price Outlook: XAU/USD Weekly Trade Levels
- Gold price updated technical trade levels - Weekly Chart
- XAU/USD surges into critical resistance confluence at 1909/22- constructive above 1795
- New to Gold Trading? Get started with this Free How to Trade Gold -Beginners Guide
Gold prices snapped a four-week wining steak into the open of June trade with XAU/USD off more than 0.8% after reversing off a key technical confluence zone. While the broader outlook remains tilted to the topside, the advance may yet be vulnerable near-term while below this key threshold. These are the updated targets and invalidation levels that matter on the gold weekly charts on the heels of today’s US Non-Farm Payroll (NFP) release. Review my latest Weekly Strategy Webinar for an in-depth breakdown of this gold technical setup and more.
Gold Price Chart - XAU/USD Weekly
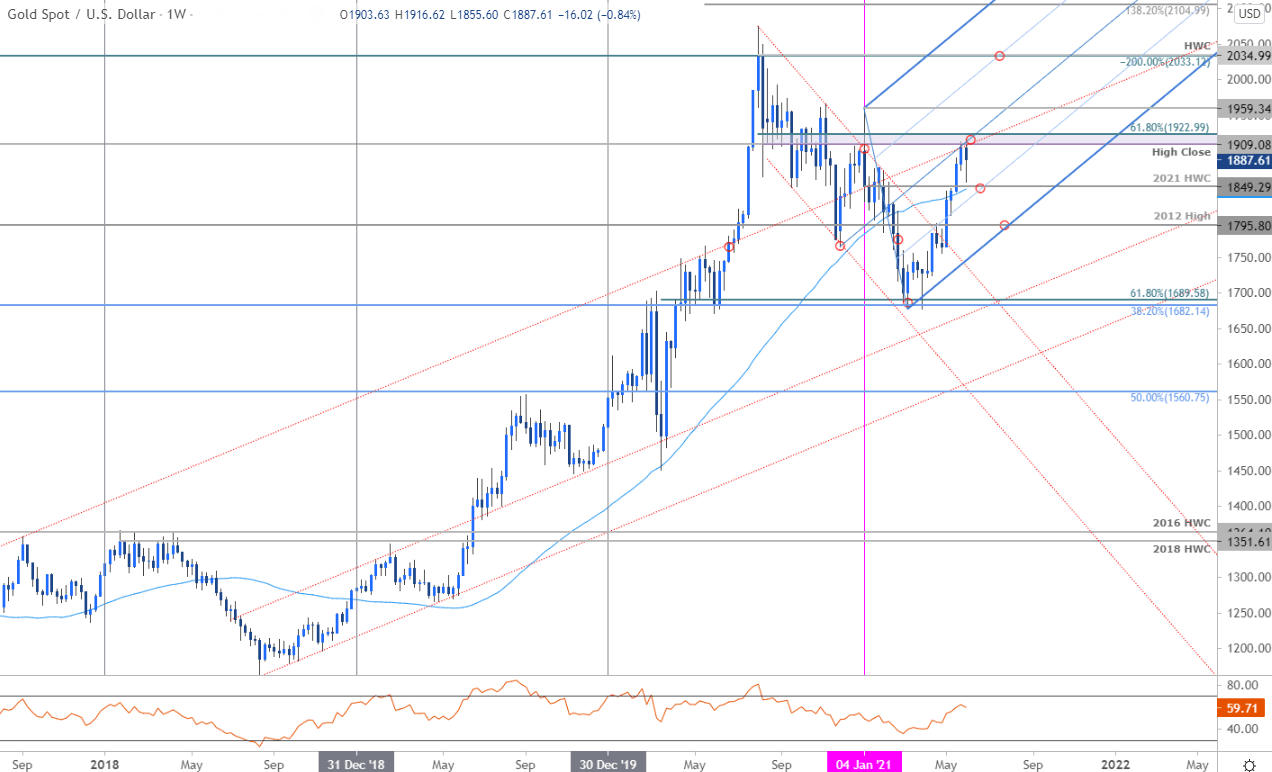
Chart Prepared by Michael Boutros, Technical Strategist; Gold on Tradingview
Notes: In last month’s Gold Weekly PriceOutlook we noted that the XAU/USD rally, “remains constructive while above 1840 – look to reduce long-exposure / raise protective stops on a test of confluent technical resistance at 1909/23.” Price registered a high this week at 1916 before reversing lower – was that the extent of the pullback?
Initial weekly support rests with the 52-week moving average / the yearly high-week reversal close at 1846/49 with broader bullish invalidation now raised to the 2012 high at 1795- an area of interest for possible downside exhaustion IF reached. Ultimately a topside breach / close above the 2011 high-close / 61.8% Fibonacci retracement at 1923 is needed to mark resumption of the broader uptrend with such a scenario exposing subsequent resistance objectives at the 2021 yearly high at 1959 and the 2020 high-week close at 2034.

Bottom line: A multi-month rally of more than 13% takes Gold prices into a critical resistance confluence and leaves the bulls vulnerable while below 1923. From a trading standpoint, a good zone to reduce long-exposure / raise protective stops- look for downside exhaustion ahead of 1795 IF price is indeed heading higher with a breach exposing the yearly highs. Review my latest Gold Price Outlook for a closer look at the near-term XAU/USD technical trade levels.
For a complete breakdown of Michael’s trading strategy, review his Foundations of Technical Analysis series on Building a Trading Strategy
Gold Trader Sentiment – XAU/USD Price Chart
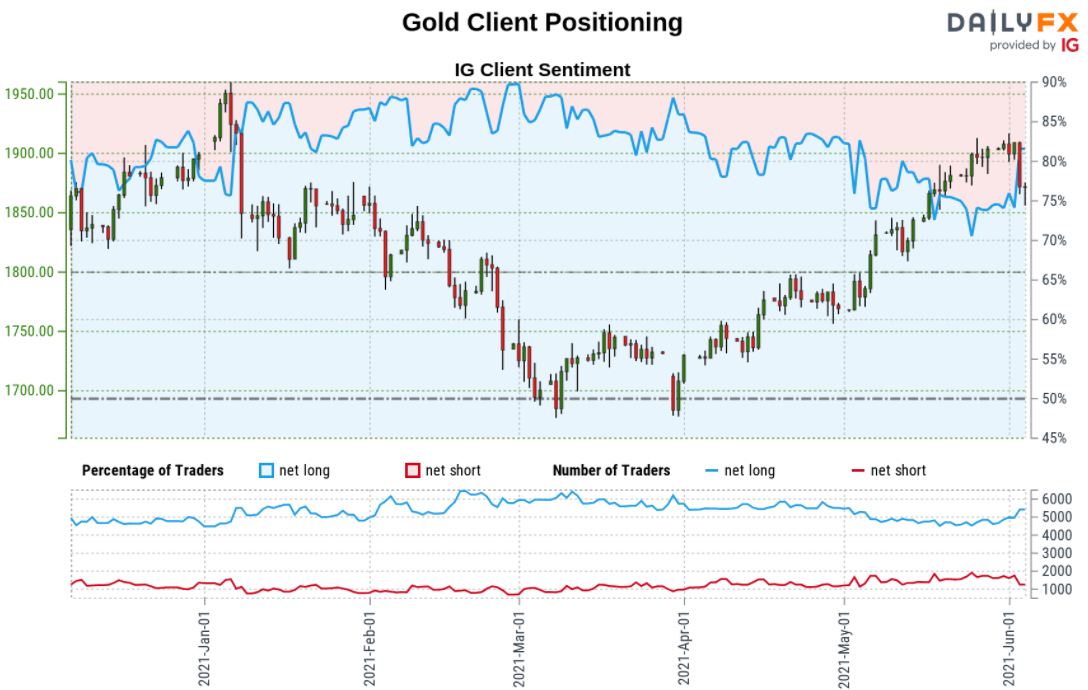
- A summary of IG Client Sentiment shows traders are net-long Gold- the ratio stands at +4.00 (80.01% of traders are long) – typically bearishreading
- Long positions are0.13% higher than yesterday and 4.21% higher from last week
- Short positions are22.69% lower than yesterday and 24.36% lower from last week
- We typically take a contrarian view to crowd sentiment, and the fact traders are net-long suggests Gold prices may continue to fall. Traders are further net-long than yesterday and last week, and the combination of current positioning and recent changes gives us a stronger Gold-bearish contrarian trading bias from a sentiment standpoint.
| Change in | Longs | Shorts | OI |
| Daily | 1% | -3% | -1% |
| Weekly | 2% | -8% | -2% |
---
Previous Weekly Technical Charts
- New Zealand Dollar (NZD/USD)
- US Dollar Index (DXY)
- Sterling (GBP/USD)
- Crude Oil (WTI)
- Canadian Dollar (USD/CAD)
- Australian Dollar (AUD/USD)
- Japanese Yen (USD/JPY)
- Written by Michael Boutros, Currency Strategist with DailyFX
Follow Michael on Twitter @MBForex


