


US Dollar Technical Price Outlook: DXY Weekly Trade Levels
- US Dollar technical trade level update – Weekly Chart
- USD sell-off stalls into yearly open support- rebound choked by PCE Inflation release
- DXY weekly support at 89.93, 89.07 - resistance / bearish invalidation 91
The US Dollar Index reversed off fresh multi-month lows this week with DXY relinquishing much of the gains on the heels of Friday’s US PCE Inflation data. The move leaves USD in a precarious position just above yearly open support as we head into the May close and while the broader risk remains tilted to the downside, the bears may yet be vulnerable while above this key threshold. These are the updated technical targets and invalidation levels that matter on the US Dollar Index weekly price chart heading into June trade. Review my latest Strategy Webinar for an in-depth breakdown of this DXY technical setup and more.
US Dollar Index Price Chart – DXY Weekly
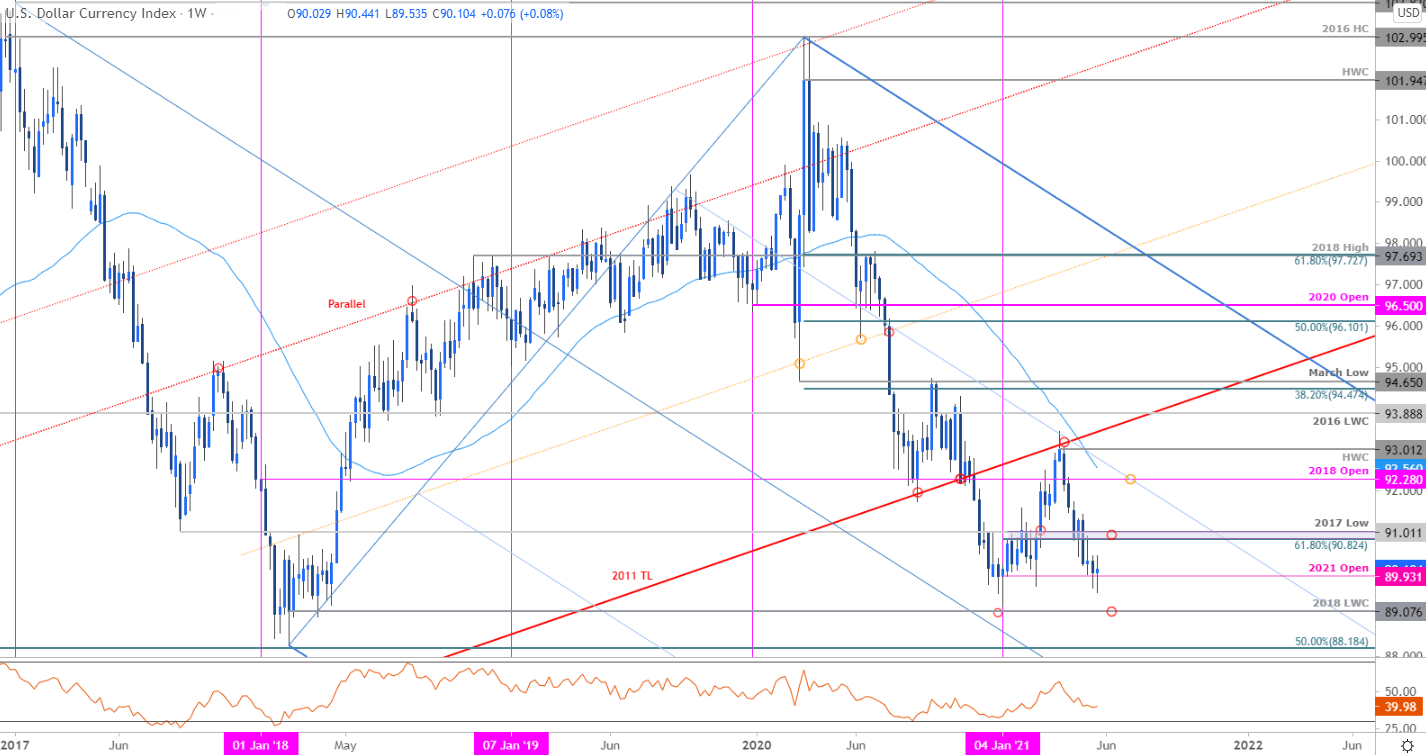
Chart Prepared by Michael Boutros, Technical Strategist; US Dollar Index on Tradingview
Notes: In my last US Dollar Weekly Price Outlook we noted that the DXY had broken to multi-month lows with the index eyeing, “the objective 2021 yearly open at 89.83 backed by the 2018 low-week / yearly low at 89.07/20- look for a larger reaction there IF reached.” Price registered an intra-week low at 89.53 before rebounding sharply with price poised to mark a fractional weekly advance. Note that the index has failed to register a weekly close below the yearly open yet again and keep the focus on a broader inflection off this threshold.
Support objectives remain unchanged at 89.93 9 and 89.07/20- a break / close beyond this threshold would be needed to constitute a breakout of the yearly opening-range with such a scenario likely to fuel another bout of accelerated losses towards the 2018 low / 50% retracement around ~88.18. That said, the bears remain vulnerable while above this threshold near-term with weekly resistance eyed at the 61.8% Fibonacci retracement of the 2021 range / 2017 swing low at 90.82-91.01- look for possible price inflection there IF reached for guidance.
For a complete breakdown of Michael’s trading strategy, review his Foundations of Technical Analysis series on Building a Trading Strategy
Bottom line: The US Dollar sell-off has stalled with the index threatening a weekly doji off objective yearly open support. From at trading standpoint, a good region to reduce short-exposure / lower protective stops. Look for topside exhaustion ahead of the 91-handle IF price is indeed heading lower. Ultimately, a close back below the yearly low-day close / this week’s low at 89.53 would be needed to mark resumption towards the January lows. I’ll publish an updated US Dollar Price Outlook once we get further clarity on the near-term technical DXY trading levels.

Key US Data Releases

Economic Calendar - latest economic developments and upcoming event risk.
Previous Weekly Technical Charts
- Sterling (GBP/USD)
- Gold (XAU/USD)
- Crude Oil (WTI)
- Canadian Dollar (USD/CAD)
- Australian Dollar (AUD/USD)
- Japanese Yen (USD/JPY)
- New Zealand Dollar (NZD/USD)
--- Written by Michael Boutros, Technical Strategist with DailyFX
Follow Michael on Twitter @MBForex
https://www.dailyfx.com/forex/technical/article/fx_technical_weekly/2021/05/21/Gold-Price-Forecast-Gold-Soars-Towards-Resistance-at-Multi-month-High.html


