


US Dollar Technical Price Outlook: DXY Weekly Trade Levels
- US Dollar technical trade level update – Weekly Chart
- USD sell-off halted by yearly open support- recovery in focus heading into FOMC
- DXY weekly support at 89.93, 89.07 - resistance at 91, bearish invalidation 92.30
The US Dollar Index plummeted into the objective yearly open last month with the USD failing to break key support for a fifth consecutive week. While the broader outlook remains titled to the downside, the immediate focus is on a possible recovery while above this key threshold with the FOMC interest rate decision on tap next week. These are the updated technical targets and invalidation levels that matter on the US Dollar Index weekly price chart heading into the Fed. Review my latest Strategy Webinar for an in-depth breakdown of this DXY technical setup and more.
US Dollar Index Price Chart – DXY Weekly
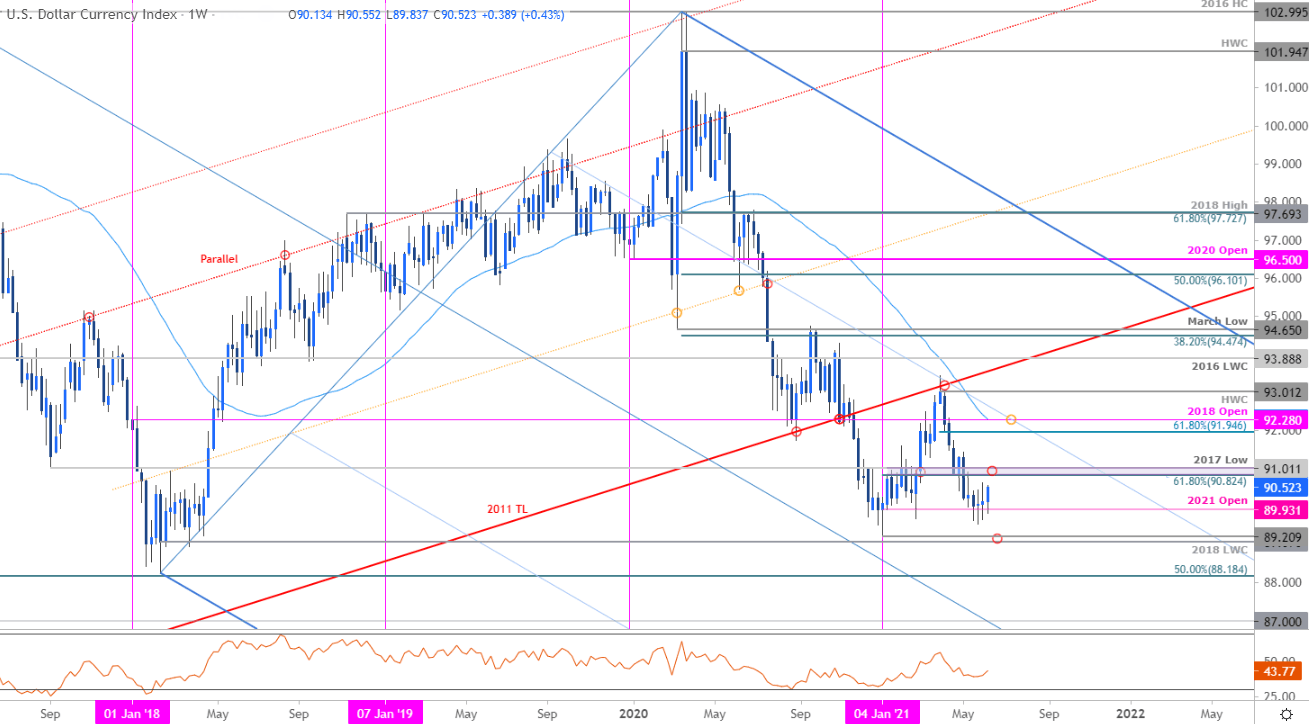
Chart Prepared by Michael Boutros, Technical Strategist; US Dollar Index on Tradingview
Notes: In my last US Dollar Weekly Price Outlook we noted that the US Dollar sell-off had, “stalled with the index threatening a weekly doji off objective yearly open support. From at trading standpoint, a good region to reduce short-exposure / lower protective stops. Look for topside exhaustion ahead of the 91-handle IF price is indeed heading lower.” The index tested key support at 89.93 for a fifth consecutive week with the USD failing to mark a single weekly close below as momentum holds 40.
Initial weekly resistance remains at the 61.8% Fibonacci retracement of the 2021 range / 2017 swing low at 90.82-91.01- look for possible price inflection there IF reached for guidance with a breach / close above needed to suggest a more significant breakout is underway towards 91.95 and the 2018 yearly open / 52-week moving average at 92.28/30(broader bearish invalidation). Support steady at 89.93 with a break / close below the 2018 low-week close / 2021 opening-range low at 89.07/20 needed to fuel the next leg lower for the Dollar.
For a complete breakdown of Michael’s trading strategy, review his Foundations of Technical Analysis series on Building a Trading Strategy
Bottom line: The US Dollar has defended yearly open support at 89.93 for over a month now and leaves the broader short-bias vulnerable while above. From a trading standpoint, the immediate focus is on this stretch towards 90.82-91.01 – look for downside exhaustion ahead of the May low-week close at 90.05 IF price is indeed heading higher with breach of the 91-handle needed to threaten a larger USD reversal. Keep in mind we get the updated economic projections on growth, inflation and employment from the Federal Reserve next week amid an increased focus on recent acceleration in price growth. The current market environment is vulnerable to a washout so stay nimble as heading into the release. I’ll publish an updated US Dollar Price Outlook once we get further clarity on the near-term technical DXY trading levels.

Key US Data Releases

Economic Calendar - latest economic developments and upcoming event risk.
Previous Weekly Technical Charts
- Gold (XAU/USD)
- New Zealand Dollar (NZD/USD)
- Sterling (GBP/USD)
- Crude Oil (WTI)
- Canadian Dollar (USD/CAD)
- Australian Dollar (AUD/USD)
- Japanese Yen (USD/JPY)
--- Written by Michael Boutros, Technical Strategist with DailyFX
Follow Michael on Twitter @MBForex


