


US Dollar Technical Price Outlook: DXY Near-term Trade Levels
- US Dollar technical updated technical trade levels – Daily & Intraday Charts
- USD breakout testing first hurdle at uptrend resistance – NFPs on tap
- Key resistance into 93.55 - Support eyed at 92.46, constructive above 91.75
The US Dollar Index is up more than 0.3% since the start of the week with DXY attempting to mark a third consecutive weekly advance. The rally takes the index into the first major resistance hurdle and while the broader focus remains constructive, the immediate advance may be vulnerable while below uptrend resistance into the April open. These are the updated technical targets and invalidation levels that matter on the US Dollar Index price chart heading into NFPs tomorrow. Review my latest Strategy Webinar for an in-depth breakdown of this DXY technical setup and more.
US Dollar Index Price Chart – DXY Daily
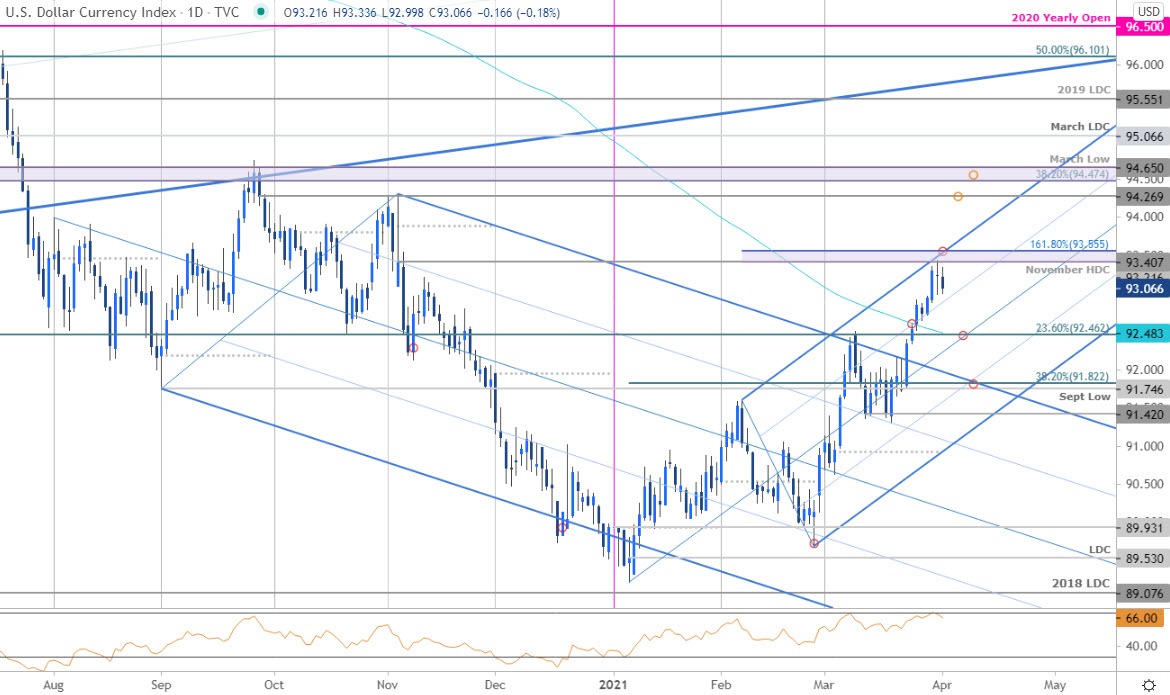
Chart Prepared by Michael Boutros, Technical Strategist; US Dollar Index on Tradingview
Technical Outlook: Earlier this month we highlighted the threat of a US Dollar breakout as the index was approaching multi-month downtrend resistance. The post-FOMC reversal fueled a rally of more than 2.3% with the a breakout one week later taking DXY to fresh yearly highs. The advance is now testing the first major resistance hurdle at 93.40/55 – a region defined by the November high-day close and the 1.618% extension of the yearly advance.
Note that the upper parallel of the ascending pitchfork formation extending off the yearly lows also converges on this region and further highlights its technical significance. A breach / close above is needed to keep the immediate long-bias viable heading into April with such a scenario exposing 94.26 and the 38.2% Fibonacci retracement / March low at 94.47/65 (key).
US Dollar Index Price Chart – DXY 240min
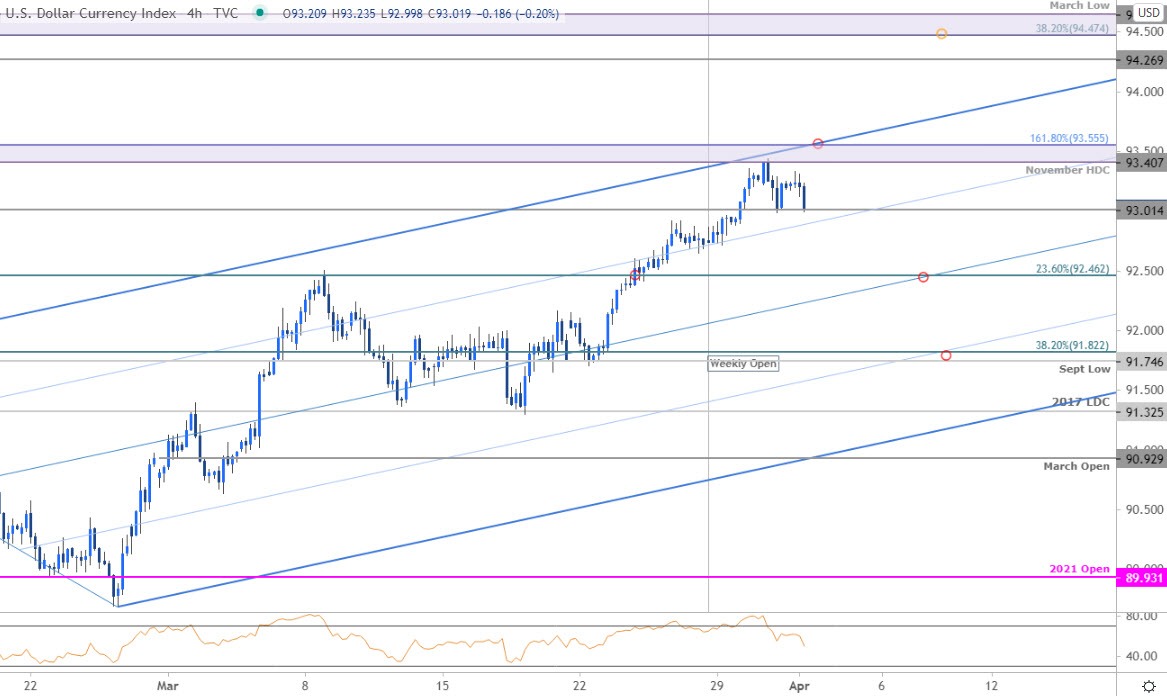
Notes: A closer look at DXY price action shows the dollar reversing off resistance with the price marking a daily doji off the highs yesterday. Initial support eyed at the 75% parallel backed by the weekly open at 92.77 and the 23.6% retracement / 200-day moving average at 92.46/48 – look for inflection there IF reached. A break below the median-line would threaten a larger correction towards more significant support and broader bullish invalidation at the September low / 38.2% retracement at 91.75/82.

Bottom line: The US Dollar breakout may be vulnerable into the April open while below 93.55 in DXY. From a trading standpoint, a good zone to reduce long-exposure / raise protective stops – be on the lookout for possible downside exhaustion ahead of the median-line IF price is indeed heading higher. Ultimately, a larger setback may offer more favorable opportunities closer to trend support. Keep in mind we’re heading into the April opening-range with US Non-Farm Payrolls on tap ahead of the extended holiday break – stay nimble into the close. Review my latest US Dollar Weekly Price Outlook for an in-depth look at the longer-term DXY technical trade levels.
For a complete breakdown of Michael’s trading strategy, review his Foundations of Technical Analysis series on Building a Trading Strategy
---
Key US Economic Data Releases
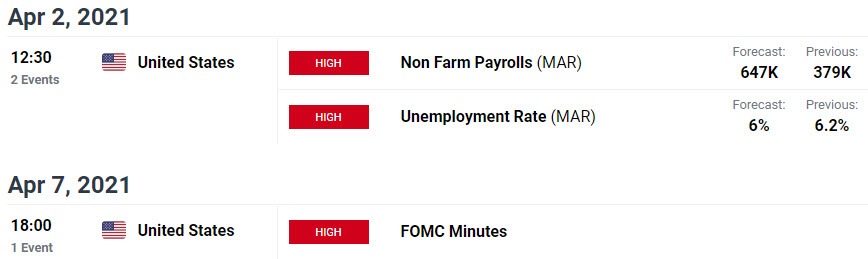
Economic Calendar - latest economic developments and upcoming event risk.
Active Technical Setups
- Euro Outlook: EUR/USD Plummets Towards 1.17- Bear March into April
- Gold Price Outlook: Gold Bears Emerge as XAU/USD Plunges- GLD Levels
- Sterling Outlook: GBP/USD Coil Tightens Post-BoE/Fed– Breakout Levels
- Australian Dollar Outlook: AUD/USD Break Tests First Aussie Hurdle
- Canadian Dollar Outlook: USD/CAD Bearish Rebuke- BoC Battle Lines
- Written by Michael Boutros, Currency Strategist with DailyFX
Follow Michael on Twitter @MBForex


