


Gold Technical Price Outlook: XAU/USD Near-term Trade Levels
- Gold price updated technical trade levels – Daily & Intraday Charts
- XAU/USD reversal from downtrend resistance?- Bearish invalidation 1767, key support 1690
- New to Gold Trading? Get started with this Free How to Trade Gold -Beginners Guide
Gold prices plunged more than 1% into the weekly open with XAU/USD plummeting to two-week lows in early US trade. The decline threatens a larger price correction but beware of the month / quarter-end flows here with gold still holding within the objective March opening-range. These are the updated targets and invalidation levels that matter on the XAU/USD technical charts heading into the close of March. Review my latest Strategy Webinar for an in-depth breakdown of this gold technical setup and more.
Gold Price Chart - XAU/USD Daily
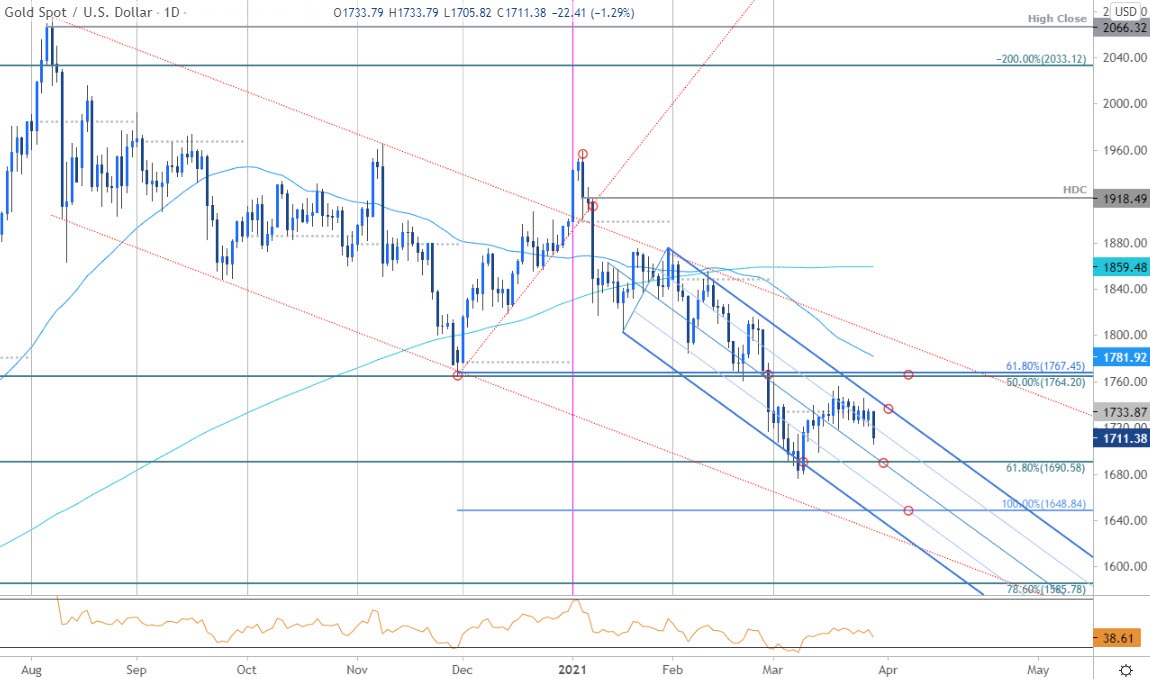
Chart Prepared by Michael Boutros, Technical Strategist; Gold on Tradingview
Technical Outlook: In my last Gold Price Outlook we noted that XAU/USD was ranging just below downtrend resistance to be on the lookout, “for a break of the weekly opening-range for guidance with the broader risk still for a deeper correction while below 1767.” Price briefly registered a high at 1755 before turning lower post-FOMC with the range continuing to hold – until today.
The first major daily support objective is eyed back at the median-line / 61.8% Fibonacci retracement of the 2020 yearly range 1690- a break / close below this threshold would be needed to keep the short-bias viable towards more significant support at the 100% extension at 1649 (an area of interest for possible downside exhaustion IF reached). Daily resistance eyed at the upper parallel with breach / close above 1764/67 ultimately needed to suggest a more significant low was registered this month.
Gold Price Chart - XAU/USD 240min
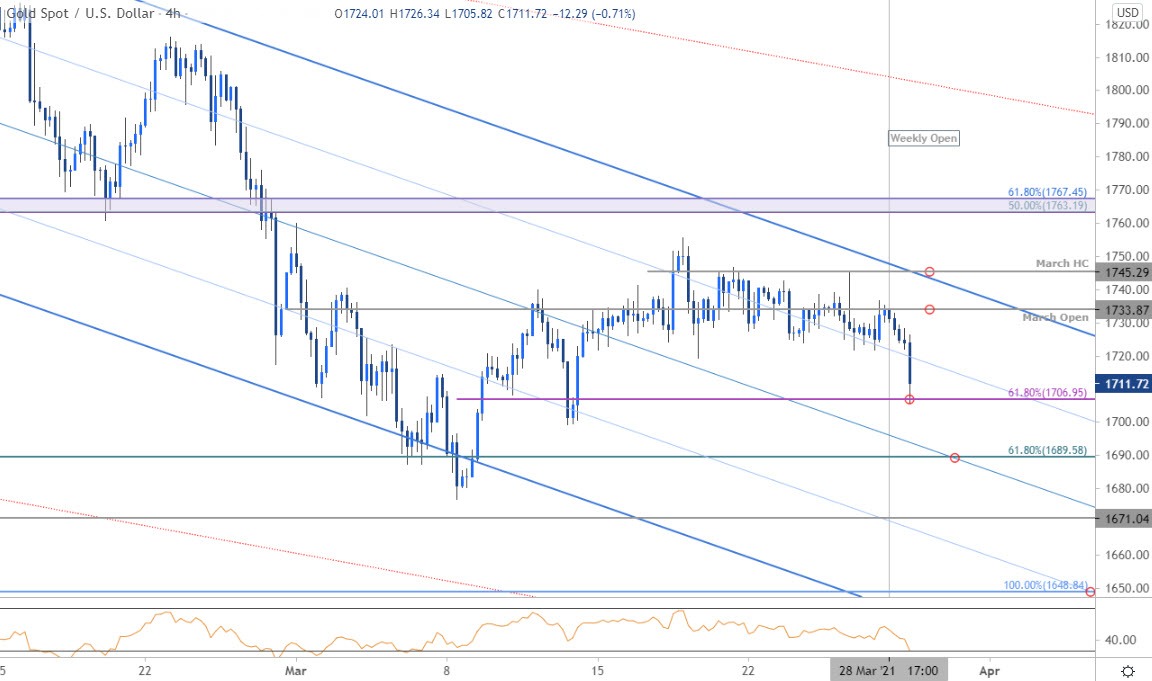
Notes: A closer look at Gold price action shows XAU/USD turning from monthly-open resistance at 1733 into the start of the week- near-term bearish invalidation now lowered to the March high-close at 1745. Initials support being tested here at the 61.8% retracement of the monthly advance at 1706 backed closely by the 1690-Fibonacci level and the yearly low-day reversal close at 1683. Basically, the downside is littered with levels here but IF price breaks lower, expect another accelerated drop towards more significant support at 1649.

Bottom line: Gold prices risk resumption of the broader downtrend with a break below 1690. From at trading standpoint, recoveries should be limited by 1745 IF price is indeed heading lower with a break exposing more significant support near 1650. Ultimately, a larger correction may offer more favorable opportunities closer to broader uptrend support. Keep in mind we’re heading into the close of the month / quarter on Wednesday – stay nimble into the April open with NFPs on tap ahead of the extended holiday weekend. Review my latest Gold Weekly Price Outlook for a closer look at the longer-term XAU/USD technical trading levels.
For a complete breakdown of Michael’s trading strategy, review his Foundations of Technical Analysis series on Building a Trading Strategy
Gold Trader Sentiment – XAU/USD Price Chart

- A summary of IG Client Sentiment shows traders are net-long Gold- the ratio stands at +5.07 (83.53% of traders are long) – typically bearish reading
- Long positions are5.75% higher than yesterday and 3.81% lower from last week
- Short positions are 0.89% lower than yesterday and 8.30% lower from last week
- We typically take a contrarian view to crowd sentiment, and the fact traders are net-long suggests Gold prices may continue to fall. Traders are further net-long than yesterday and last week, and the combination of current positioning and recent changes gives us a stronger Gold-bearish contrarian trading bias from a sentiment standpoint.
| Change in | Longs | Shorts | OI |
| Daily | 1% | -3% | -1% |
| Weekly | 2% | -8% | -2% |
---
Active Technical Setups
- Sterling Outlook: GBP/USD Coil Tightens Post-BoE/Fed– Breakout Levels
- Australian Dollar Outlook: AUD/USD Break Tests First Aussie Hurdle
- Canadian Dollar Outlook: USD/CAD Bearish Rebuke- BoC Battle Lines
- Written by Michael Boutros, Technical Strategist with DailyFX
Follow Michael on Twitter @MBForex


