


Gold Technical Price Outlook: XAU/USD Near-term Trade Levels
- Gold price updated technical trade levels – Daily & Intraday Charts
- XAU/USD breakdown vulnerable into trend support- Bearish invalidation 1785, key support 1690
- New to Gold Trading? Get started with this Free How to Trade Gold -Beginners Guide
Gold prices have plunged more than 9% off the February highs with XAU/USD attempting to mark a third consecutive weekly decent. While a break below key technical support into the close of February does leave the broader risk lower in price, the sell-off is now testing downtrend support and leaves the immediate decline vulnerable into NFP’s tomorrow. These are the updated targets and invalidation levels that matter on the XAU/USD technical charts heading into the close of the week. Review my latest Strategy Webinar for an in-depth breakdown of this gold technical setup and more.
Gold Price Chart - XAU/USD Daily
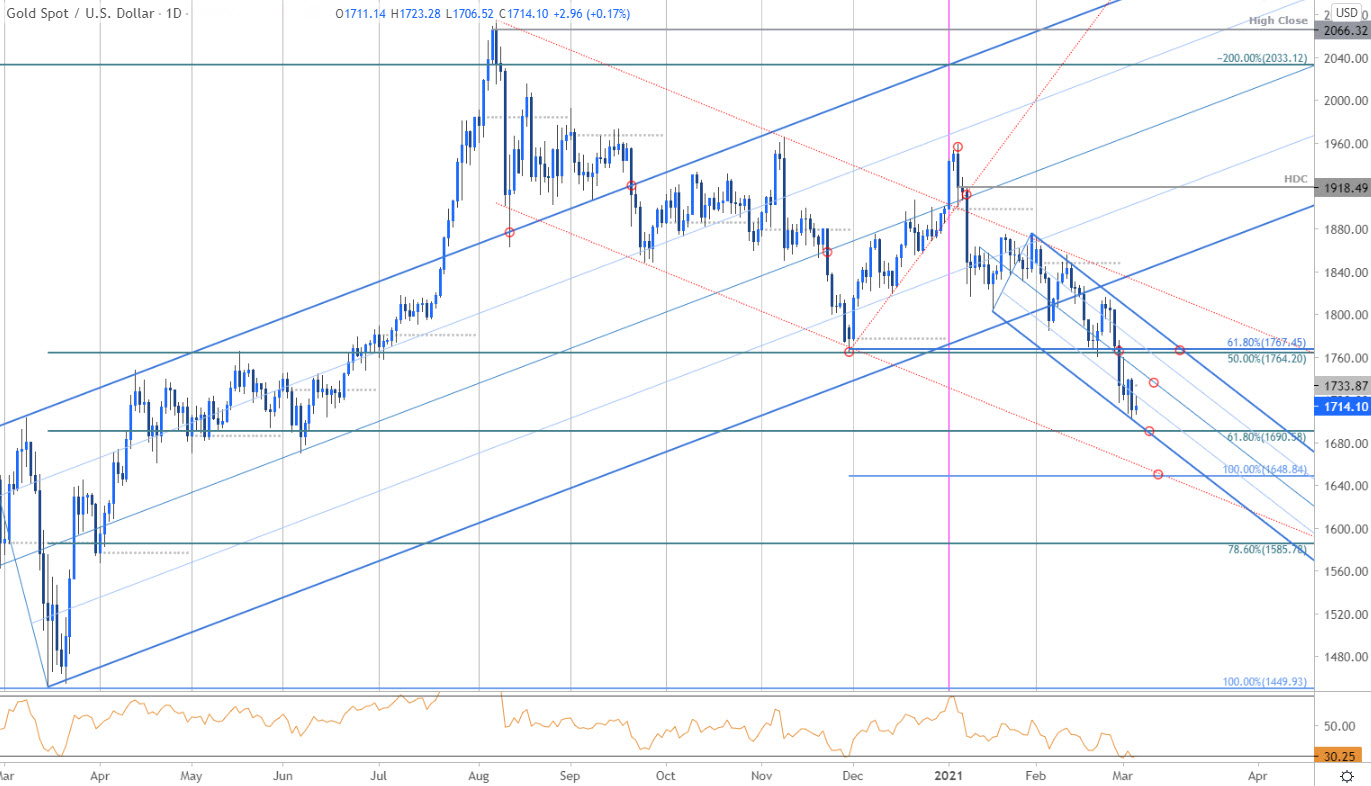
Chart Prepared by Michael Boutros, Technical Strategist; Gold on Tradingview
Technical Outlook: In my last Gold Price Outlook we noted that the recent XAU/USD recovery was vulnerable and to, “Watch for topside exhaustion ahead of the upper parallel IF price is heading lower with a break below key support exposing the 100% extension at 1739 and the lower parallels near ~1700.” A decisive break below support at 1763/67 two-days later marked a decline of more than 3.8% into the March open with gold registering a low yesterday at 1739.
The sell-off is now testing downtrend support on building momentum divergence with the 61.8% Fibonacci retracement of the 2020 yearly range just lower at 1690- a break / daily close below this threshold would be needed to keep the immediate short-bias viable. Initial daily resistance stands at the median-line (currently ~1746) backed by 1764/67- look for topside exhaustion ahead of this threshold IF price is heading lower on this stretch.
Gold Price Chart - XAU/USD 120min
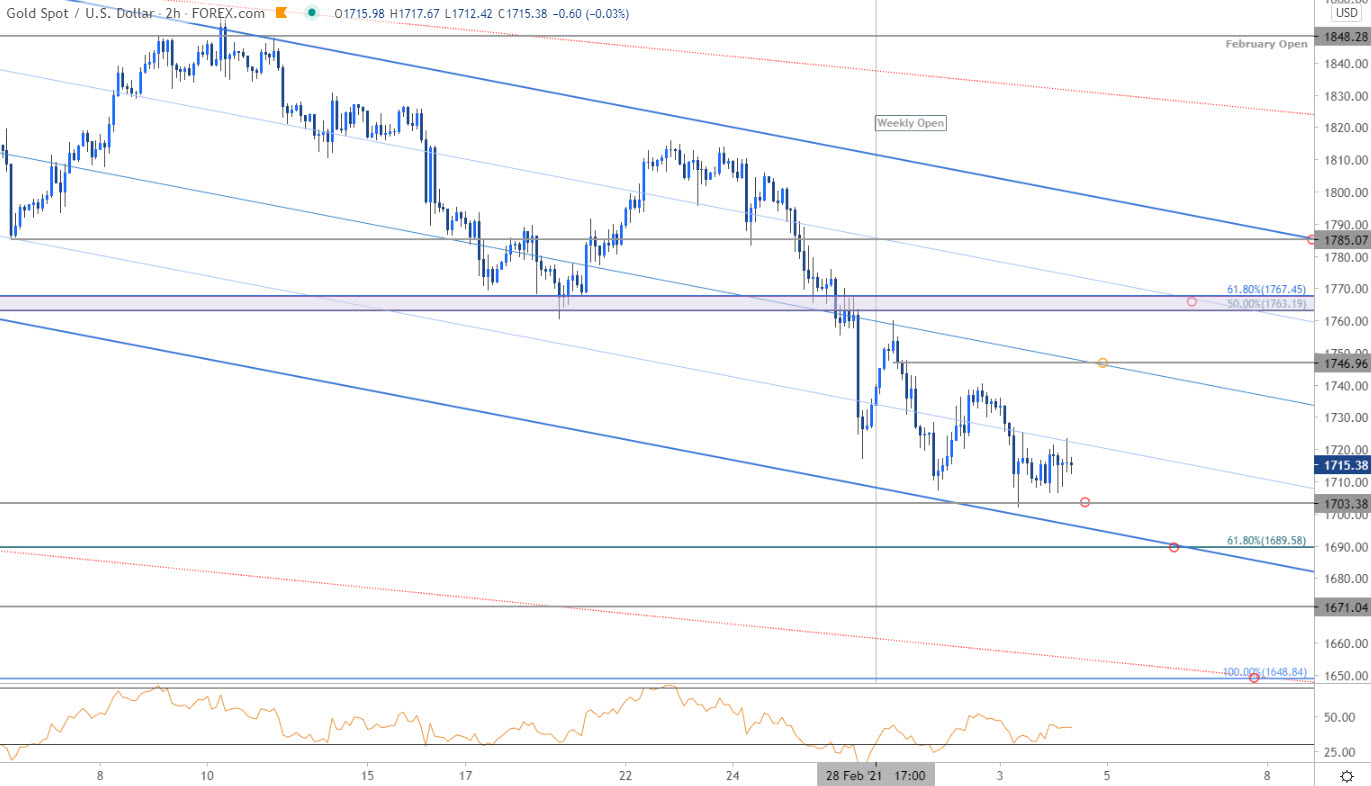
Notes: A closer look at Gold price action shows XAU/USD testing the lower parallels of the descending pitchfork formation we’ve been tracking off the late-January highs. Initial support rests at the March 2020 swing high at 1703 backed closely by 1690- look for inflection off this zone. Broader bearish invalidation now lowered to the upper parallel / February opening-range low at 1785. A break lower from here exposes 1671 and critical support at the 100% extension of the broader 2020 decline at 1648.

Bottom line: The gold breakdown is now testing the first major hurdle at downtrend support early in the month and we’re on the lookout for possible inflection into this region. From a trading standpoint, a good zone to reduce short-exposure / lower protective stops – rallies should be capped by 1767 IF price is indeed heading lower with a break / close below 1690 needed to fuel the next leg lower in price. Keep in mind, US Non-Farm Payrolls are on tap tomorrow- stay nimble into the close of the week here. Review my latest Gold Weekly Price Outlook for a closer look at the longer-term XAU/USD technical trading levels.
For a complete breakdown of Michael’s trading strategy, review his Foundations of Technical Analysis series on Building a Trading Strategy
Gold Trader Sentiment – XAU/USD Price Chart
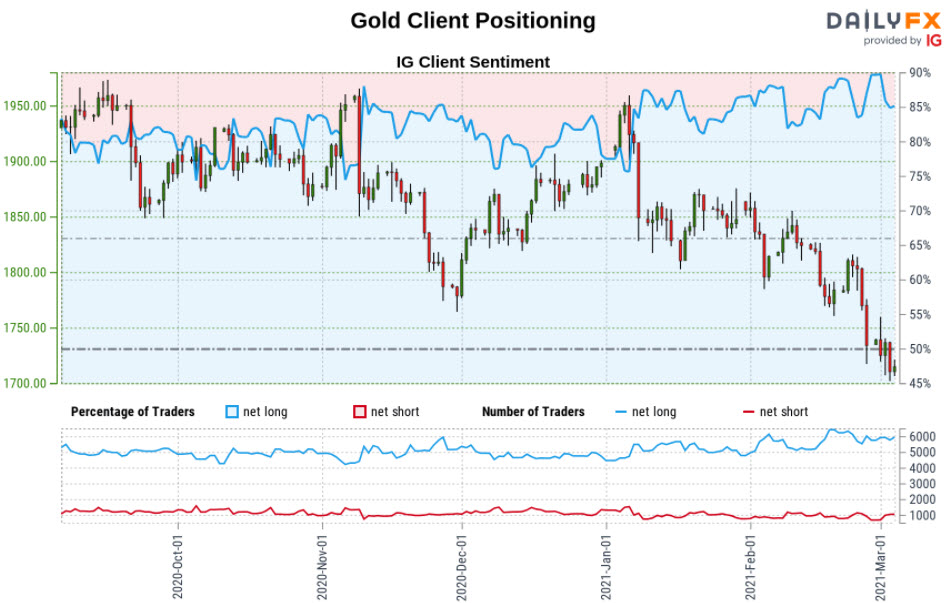
- A summary of IG Client Sentiment shows traders are net-long Gold- the ratio stands at +5.85 (85.41% of traders are long) – typically bearishreading
- Long positions are5.39% higher than yesterday and 7.80% higher from last week
- Short positions are 23.37% lower than yesterday and 19.85% lower from last week
- We typically take a contrarian view to crowd sentiment, and the fact traders are net-long suggests Gold prices may continue to fall. Traders are further net-long than yesterday and last week, and the combination of current positioning and recent changes gives us a stronger Gold-bearish contrarian trading bias from a sentiment standpoint.
| Change in | Longs | Shorts | OI |
| Daily | -3% | -5% | -4% |
| Weekly | -1% | -10% | -5% |
---
Active Technical Setups
- Bitcoin (BTC/USD) Outlook: Bitcoin Bulls Back Down- 50K back in Play
- Canadian Dollar Outlook: USD/CAD Threatens Major Breakdown
- Sterling Outlook: GBP/USD Breakout Extends to First Resistance Hurdle
- Australian Dollar Outlook: Aussie Rally Rips to Resistance
- Written by Michael Boutros, Technical Strategist with DailyFX
Follow Michael on Twitter @MBForex


