


Sterling Technical Price Outlook: GBP/USD Trade Levels
- Sterling technical trade level update – Daily & Intraday Charts
- GBP/USD breakout extends for sixth week into confluence resistance at 1.40
- Weekly open support 1.3851 – constructive while above February open at 1.3710
The British Pound surged nearly 4% off the January lows against the US Dollar with GBP/USD attempting to mark a sixth consecutive weekly advance. The breakout is now testing the first major resistance hurdle and we are looking for a reaction up here for guidance. These are the updated targets and invalidation levels that matter on the GBP/USD price charts. Review my latest Weekly Strategy Webinar for an in-depth breakdown of this Cable trade setup and more.
Sterling Price Chart – GBP/USD Daily
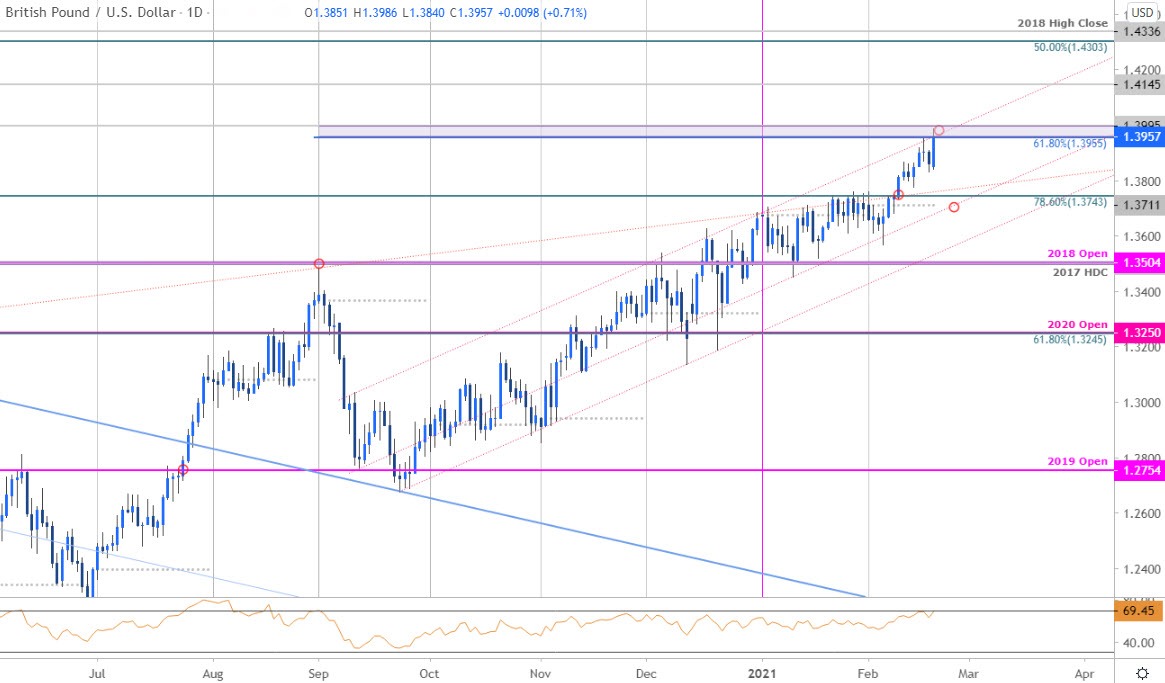
Chart Prepared by Michael Boutros, Technical Strategist; GBP/USD on Tradingview
Technical Outlook: The British Pound broke to fresh multi-year highs in early-February with GBP/USD rallying more than 3% off the monthly lows. The rally is now testing a key technical confluence zone we’ve been tracking for months now at channel resistance / 1.3955/95- a region defined by the 61.8% extension of the 2020 advance and the 2018 high-week reversal close. Looking for inflection off this zone for guidance in the days ahead.
Initial daily support rests back at 1.3743 with bullish invalidation now raised to the objective monthly open at 1.3710- a break / close below this threshold would be needed to suggest a larger correction is underway towards the September trendline / February low near ~1.3567. A topside breach from here would likely fuel accelerated gains for the British Pound with such a scenario exposing subsequent topside resistance objectives at 1.4145 and the 50% retracement / 2018 high at 1.4303/36.
Sterling Price Chart – GBP/USD 240min

Notes: A closer look at Sterling price action shows GBP/USD rallying into confluence resistance today on building momentum divergence – the immediate advance may be vulnerable while below this key threshold. Weekly open support rests at 1.3851 backed by the median-line around 1.3710/43- an area of interest for possible downside exhaustion IF reached. Ultimately a rally surpassing the 88.6% Fibonacci retracement at 1.4039 is needed to fuel the next leg higher in the Pound.

Bottom line: The Sterling breakout is now testing the first major resistance hurdle into the channel resistance. From a trading standpoint, a good zone to reduce long-exposure / raise protective stops – be on the lookout for possible topside exhaustion while below the 1.40-handle. Ultimately a larger pullback may offer more favorable opportunities with a broader outlook constructive while above monthly-open support. Review my latest British Pound Weekly Price Outlook for a closer look at the longer-term GBP/USD technical trade levels.
For a complete breakdown of Michael’s trading strategy, review his Foundations of Technical Analysis series on Building a Trading Strategy
Sterling Trader Sentiment – GBP/USD Price Chart

- A summary of IG Client Sentiment shows traders are net-short GBP/USD - the ratio stands at -1.55 (39.26% of traders are long) – typically bullish reading
- Long positions are2.40% lower than yesterday and 10.33% higher from last week
- Short positions are0.59% higher than yesterday and 17.52% lower from last week
- We typically take a contrarian view to crowd sentiment, and the fact traders are net-short suggests GBP/USD prices may continue to rise. Traders are more net-short than yesterday but less net-short from last week. The combination of current positioning and recent changes gives us a further mixed GBP/USD trading bias from a sentiment standpoint.
| Change in | Longs | Shorts | OI |
| Daily | -11% | 1% | -6% |
| Weekly | -16% | 20% | -3% |
---
UK / US Economic Calendar
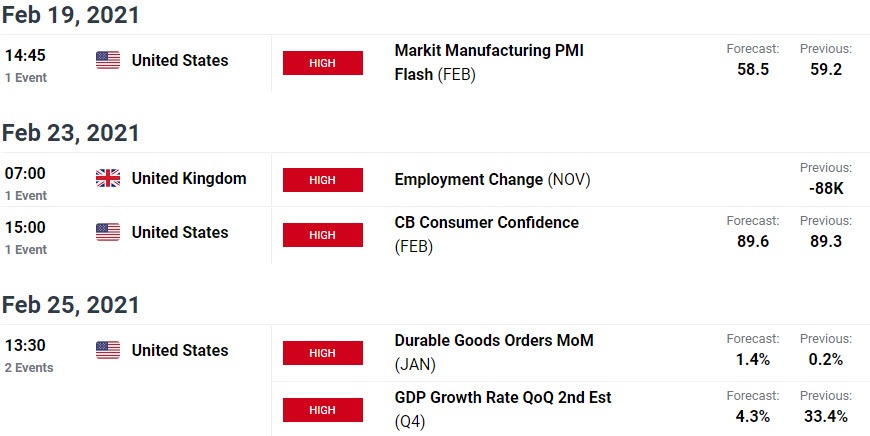
Economic Calendar - latest economic developments and upcoming event risk.
Active Trade Setups
- Australian Dollar Outlook: Aussie Rally Rips to Resistance
- Canadian Dollar Outlook: USD/CAD Rally Thwarted by Trend Resistance
- Euro Outlook: EUR/USD Plummets Past 1.20- 2021 Breakdown Intensifies
- Gold Price Outlook: Gold Recovery Coils into Resistance- XAU Levels
- US Dollar Outlook: USD Snaps Back- Are Bears Taking Control?
- Written by Michael Boutros, Currency Strategist with DailyFX
Follow Michael on Twitter @MBForex


