


Canadian Dollar Technical Price Outlook: Near-term Trade Levels
- Canadian Dollar updated technical trade levels – Daily & Intraday Charts
- USD/CAD carving monthly opening range just above key technical support
- Bears vulnerable while above 1.2575 – resistance at 1.2723, bearish invalidation 1.2881
The Canadian Dollar bulls have been halted at multi-year extremes with USD/CAD carving the March opening-range just above critical support. The battle-lines are drawn heading into the BoC this week and we’re on the lookout for a breakout of this range to offer further guidance in the days ahead. These are the updated targets and invalidation levels that matter on the USD/CAD price charts. Review my latest Strategy Webinar for an in-depth breakdown of this Loonie technical setup and more.
Canadian Dollar Price Chart – USD/CAD Daily
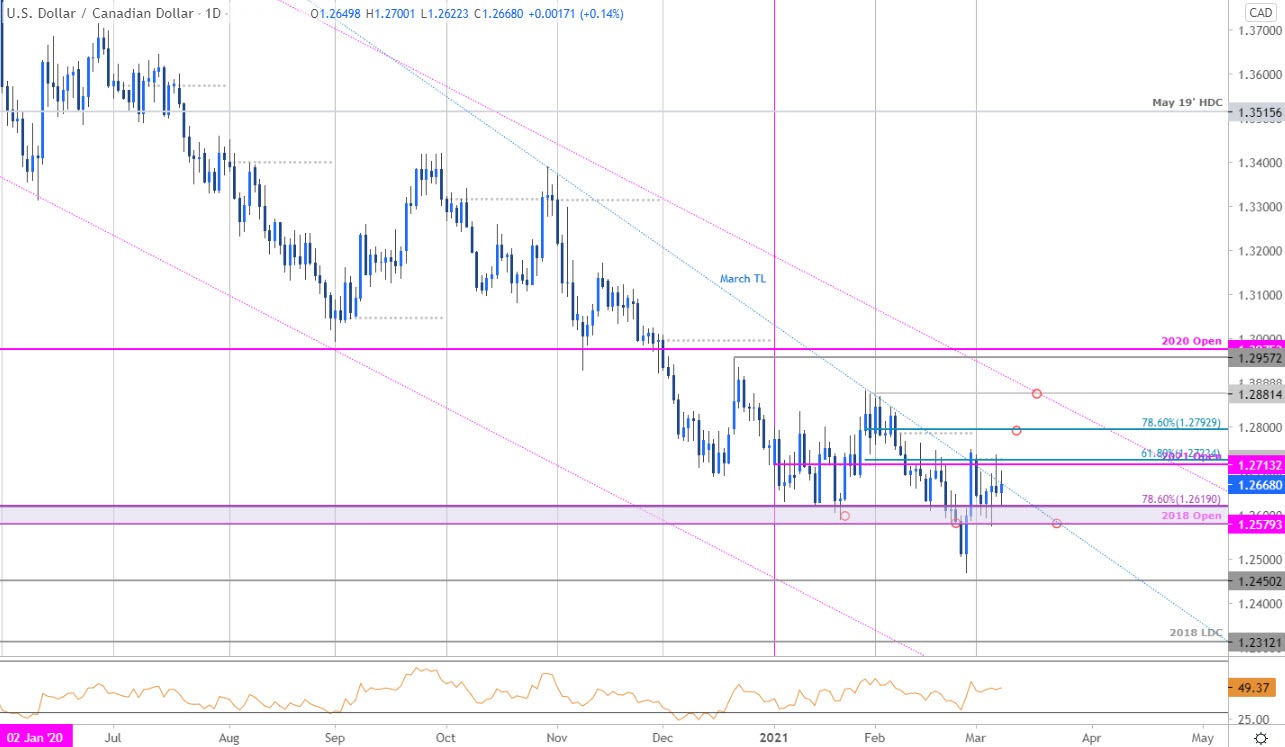
Chart Prepared by Michael Boutros, Technical Strategist; USD/CAD on Tradingview
Technical Outlook: In my most recent Canadian Dollar Price Outlook we noted that our focus was, “once again on support here at the 61.8% Fibonacci retracement of the recent rally / 2018 yearly open at 1.2575/79 backed by the April 2018 low / lower parallel near 1.2527- looking for downside exhaustion ahead of this region IF price is indeed heading higher.” The outlook remains unchanged into the start of the week with the March opening-range now taking shape just above this key support zone.
Daily resistance stands at the yearly open / 61.8% Fibonacci retracement of the 2021 range at 1.2713/23- a breach / close above would be needed to keep the late-February recovery viable with such a scenario exposing 1.2793 and the yearly range highs / channel resistance at ~1.2881- look for a larger reaction there IF reached.
Canadian Dollar Price Chart – USD/CAD 240min
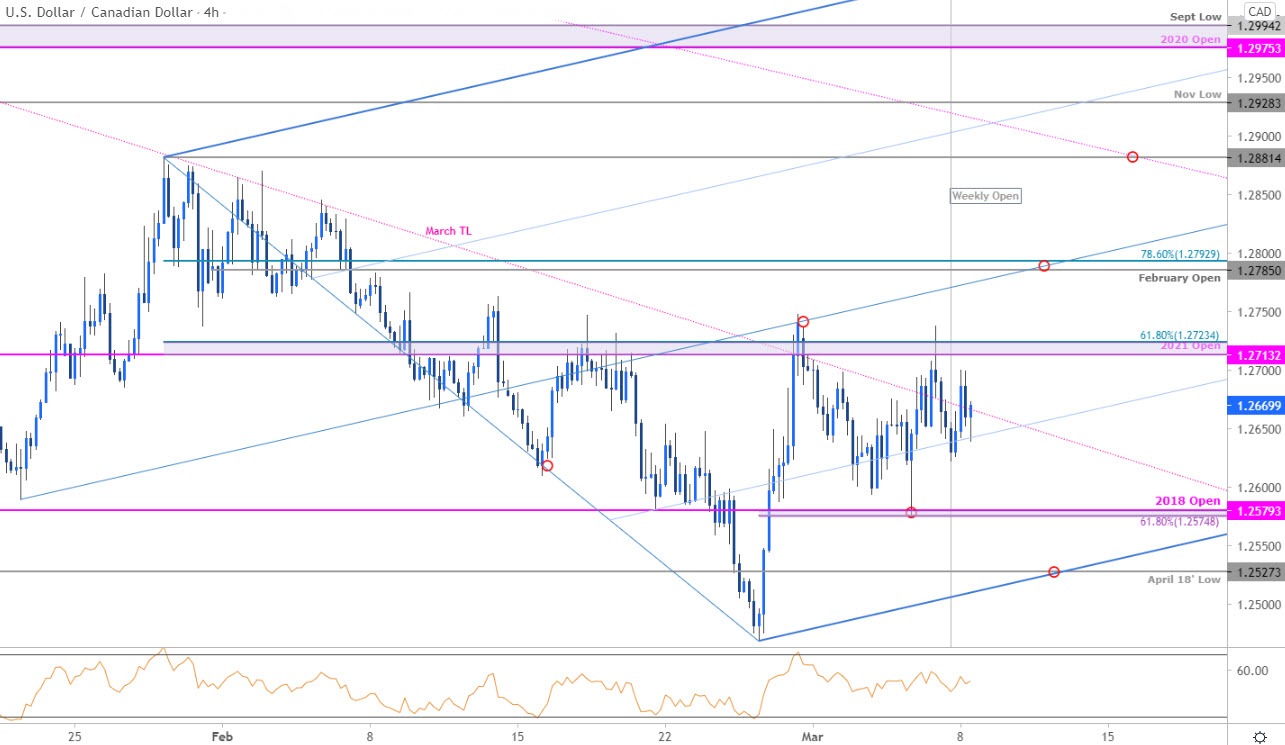
Notes: A closer look at Loonie price action shows USD/CAD continuing to trade within the confines of a proposed ascending pitchfork formation extending off the yearly lows (highlighted last week). Initial support steady at 1.2575/79 backed by the lower parallel / 1.2527- a close below this threshold would likely fuel accelerated losses with subsequent support objectives at 1.2450 and the 2018 low-day close at 1.2312.

Bottom line: The Canadian Dollar remains in a vulnerable position here after recovering back above critical support last month. The March opening-range is in focus with the USD/CAD bears at risk while above 1.2575. From a trading standpoint, be on the lookout for downside exhaustion while within this formation with a breach higher keeping the focus on the yearly range highs. Keep in mind we have the Bank of Canada (BoC) rate decision on tap this week- stay nimble. Review my latest Canadian Dollar Weekly Price Outlook for a closer look at the longer-term USD/CAD technical trade levels.
For a complete breakdown of Michael’s trading strategy, review his Foundations of Technical Analysis series on Building a Trading Strategy
Canadian Dollar Trader Sentiment – USD/CAD Price Chart
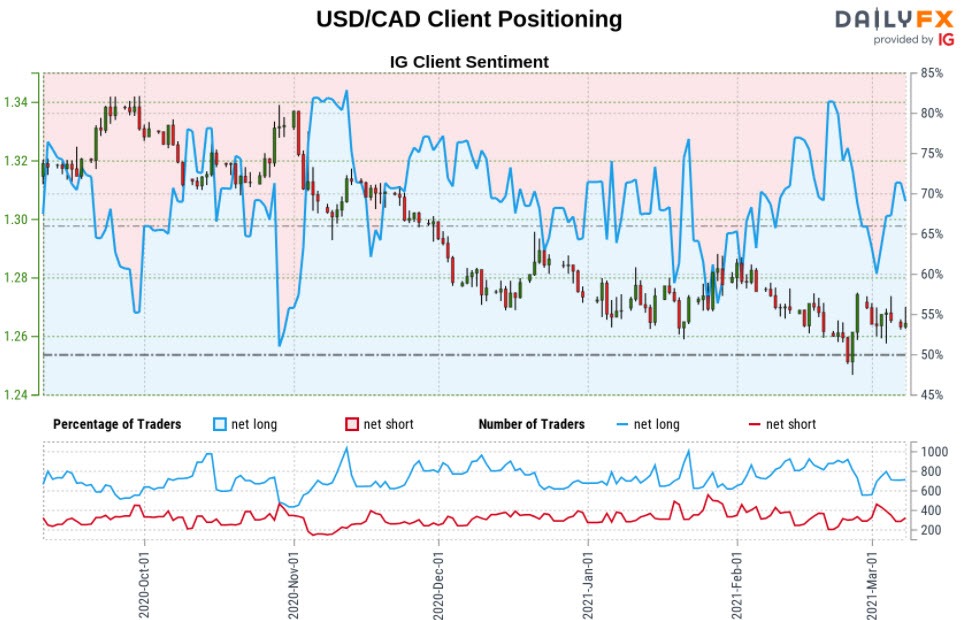
- A summary of IG Client Sentiment shows traders are net-long USD/CAD - the ratio stands at +2.13 (74.94% of traders are long) – typically bearish reading
- Long positions are6.96% higher than yesterday and 18.96% higher from last week
- Short positions are 24.73% higher than yesterday and 26.76% lower from last week
- We typically take a contrarian view to crowd sentiment, and the fact traders are net-long suggests USD/CAD prices may continue to fall. Yet traders are less net-long than yesterday but more net-long from last week and the combination of current positioning and recent changes gives us a further mixed USD/CAD trading bias from a sentiment standpoint.
| Change in | Longs | Shorts | OI |
| Daily | -2% | 7% | 5% |
| Weekly | -30% | 38% | 13% |
---
Key US / Canada Data Releases

Economic Calendar - latest economic developments and upcoming event risk.
Active Technical Setups
- Gold Price Outlook: Gold Breakdown Plunges into Downtrend Support
- Bitcoin (BTC/USD) Outlook: Bitcoin Bulls Back Down- 50K back in Play
- Sterling Outlook: GBP/USD Breakout Extends to First Resistance Hurdle
- Written by Michael Boutros, Currency Strategist with DailyFX
Follow Michael on Twitter @MBForex


