


Canadian Dollar Technical Price Outlook: USD/CAD Weekly Trade Levels
- Canadian Dollar updated technical trade levels - Weekly Chart
- USD/CAD sell-off fails at critical support – bears vulnerable into March open
- Resistance / bearish invalidation at 1.2975 - Critical support steady at 1.2579-1.2619
The Canadian Dollar rally seemingly lost steam against the US Dollar last week with USD/CAD rebounding sharply off key technical support into the close of February trade. The rally covered nearly 70% of the year-to-date range in just two days with the reversal threatening a larger recovery in the weeks ahead. These are the updated targets and invalidation levels that matter on the USD/CAD weekly technical price. Review my latest Strategy Webinar for an in-depth breakdown of this Loonie technical setup and more.
Canadian Dollar Price Chart – USD/CAD Weekly
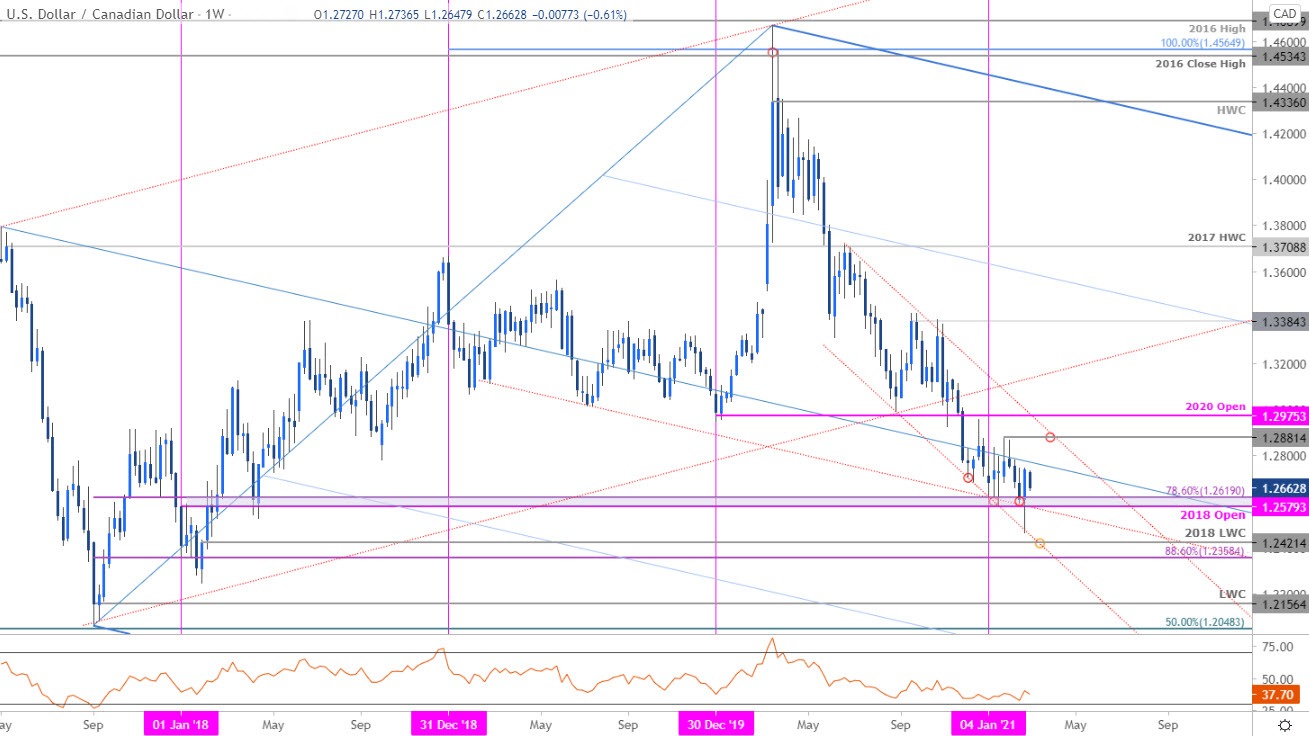
Chart Prepared by Michael Boutros, Technical Strategist; USD/CAD on Tradingview
Notes: In last month’s Canadian Dollar Weekly Price Outlook we noted that the USD/CAD was trading, “just above key technical support at 1.2579-1.2619,” – a region defined by the 2018 yearly open and the 78.6% Fibonacci retracement of 2017 advance. An intra-week drop registered a low at 1.2468 / channel support before rebounding sharply, nearly posting an outside-week reversal to close back above this key support zone. Is a low in place?
Initial weekly resistance stands at the median-line (currently ~1.2770s) backed by the yearly opening-range high at 1.2881. Ultimately a breach / weekly close above the 2020 yearly open at 1.2975 would be needed to suggest a more significant trend reversal is underway- look for a larger price inflection there IF reached. A close below 1.2579 is still needed to mark resumption of the broader downtrend with subsequent support objectives unchanged at the 2018 low-week close at 1.2421 and the 88.6% retracement at 1.2385.

Bottom line: The Canadian Dollar has failed a break below a critical support confluence we’ve been tracking for months now and leaves the bears vulnerable while above. From a trading standpoint, look for downside exhaustion ahead of 1.2579 IF price is indeed heading higher with a breach above the median-line needed to keep the focus on broader downtrend resistance. Stay nimble as we head into the March opening-range. Review my latest Canadian Dollar Price Outlook for a closer look at the near-term USD/CAD technical trade levels.
For a complete breakdown of Michael’s trading strategy, review his Foundations of Technical Analysis series on Building a Trading Strategy
Canadian Dollar Trader Sentiment – USD/CAD Price Chart
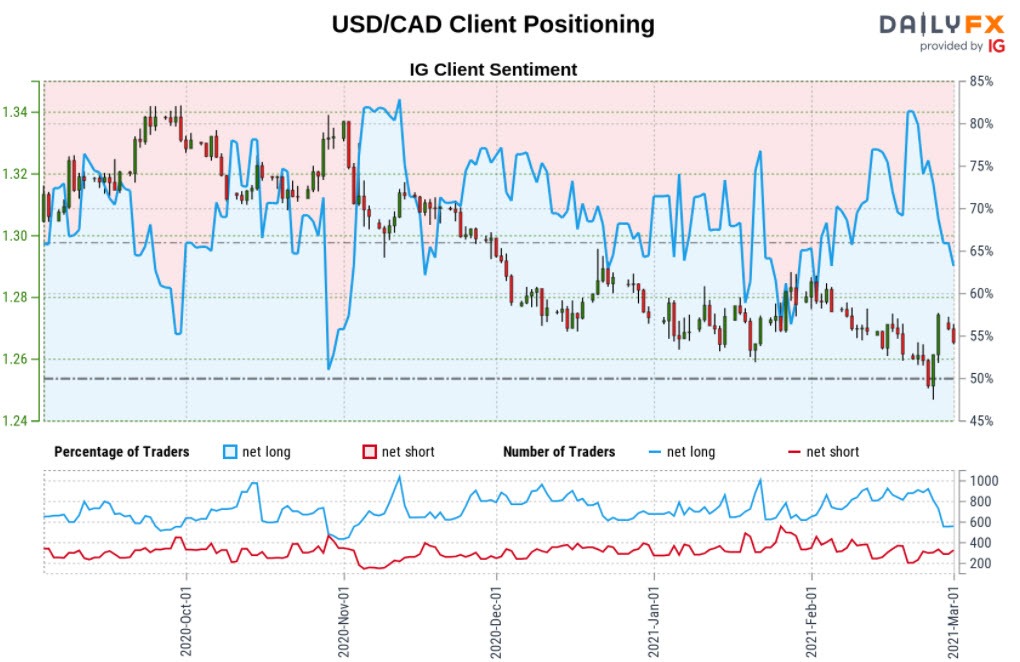
- A summary of IG Client Sentiment shows traders are net-long USD/CAD - the ratio stands at +1.31 (56.77% of traders are long) – typically bearish reading
- Long positions are 14.67% higher than yesterday and 33.02% lower from last week
- Short positions are68.53% higher than yesterday and 52.53% higher from last week
- We typically take a contrarian view to crowd sentiment, and the fact traders are net-long suggests USD/CAD prices may continue to fall. Yet traders are less net-long than yesterday and compared with last week. Recent changes in sentiment warn that the current USD/CAD price trend may soon reverse higher despite the fact traders remain net-long.
| Change in | Longs | Shorts | OI |
| Daily | -2% | 7% | 5% |
| Weekly | -30% | 38% | 13% |
---
US / Canada Economic Calendar
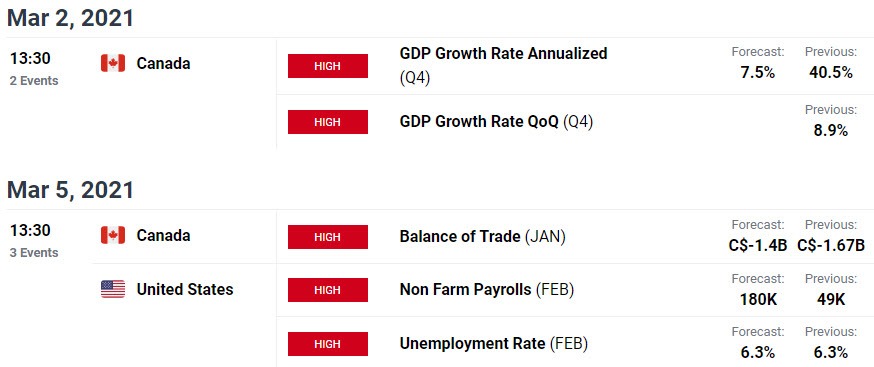
Economic Calendar - latest economic developments and upcoming event risk.
Previous Weekly Technical Charts
- Gold (XAU/USD)
- Australian Dollar (AUD/USD)
- Crude Oil (WTI)
- Sterling (GBP/USD)
- Euro (EUR/USD)
- US Dollar (DXY)
- Japanese Yen (USD/JPY)
--- Written by Michael Boutros, Technical Currency Strategist with DailyFX
Follow Michael on Twitter @MBForex


