


Japanese Yen Technical Price Outlook: USD/JPY Weekly Trade Levels
- Japanese Yen technical trade levels update – Weekly Chart
- USD/JPY breakout extends into February open
- Constructive while above 104.18 – Initial resistance objectives in view at 106
The Japanese Yen is off more than 0.7% against the US Dollar this week with a breakout in USD/JPY fueling a rally of more than 2.8% off the January lows. The advance is poised to mark a seventh consecutive day and while the broader focus remains tilted to the topside, the advance may be vulnerable in the weeks ahead as price approaches technical resistance just higher. These are the updated targets and invalidation levels that matter on the USD/JPY weekly price chart heading into NFP s tomorrow. Review my latest Weekly Strategy Webinar for an in-depth breakdown of this Yen trade setup and more.
Japanese Yen Price Chart – USD/JPY Weekly
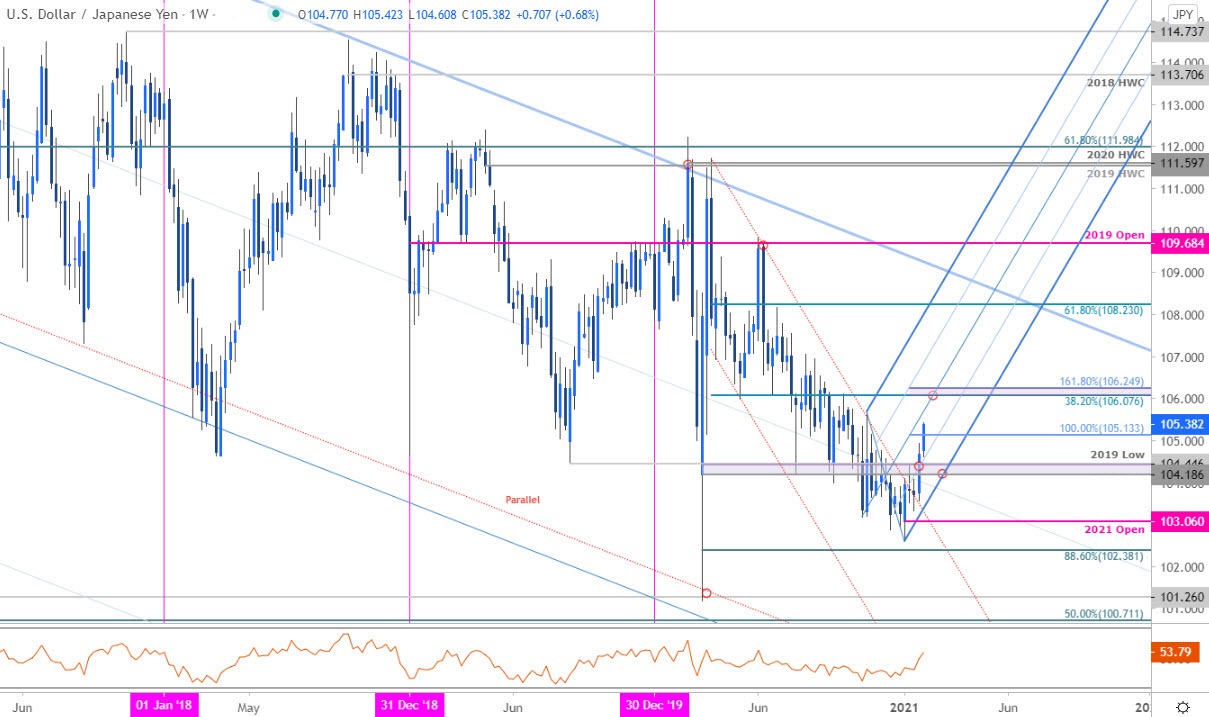
Chart Prepared by Michael Boutros, Technical Strategist; USD/JPY on Tradingview
Notes: In our last Japanese Yen Weekly Price Outlook we highlighted that USD/JPY was testing a critical support zone and to, “be on the lookout for topside exhaustion ahead of 105.59 IF price is indeed heading lower with a close below 104.12 still needed to keep the immediate short-bias viable.” Price registered a high at 105.67 in early November before plummeting more than 2.9% with the decline reversing course just pips ahead of the 88.6% Fibonacci retracement at 102.38 (low registered at 102.59).
A late-month breakout of the January opening-range has now rallied back above a key technical pivot zone at 104.18/46- a region defined by the 2020 low-week close and the July lows. The medium-term outlook remains weighted to the topside while above this threshold with initial resistance objectives now eyed at the 38.2% retracement / 1.618% extension at 106.07/25. Note that the median-line converges on this threshold over the next few weeks – look for a larger reaction there IF reached.

For a complete breakdown of Michael’s trading strategy, review his Foundations of Technical Analysis series on Building a Trading Strategy
Bottom line: A breakout of the March downtrend has been validated with the USD/JPY rally now approaching initial resistance objectives just higher. From a trading standpoint, look to reduce long-exposure / raise protective stops on a test of the median-line IF reached – ultimately a breach / close above 106.07/25 would be needed to keep the immediate advance viable. Monthly open support rests at 103.06 with bullish invalidation set to 104.18.Stay nimble here and watch the weekly close with US Non-Farm Payrolls on tap tomorrow. I’ll publish and updated Japanese Yen Price Outlook once we get further clarity on the near-term USD/JPY technical trade levels.
Japanese Yen Trader Sentiment – USD/JPY Price Chart
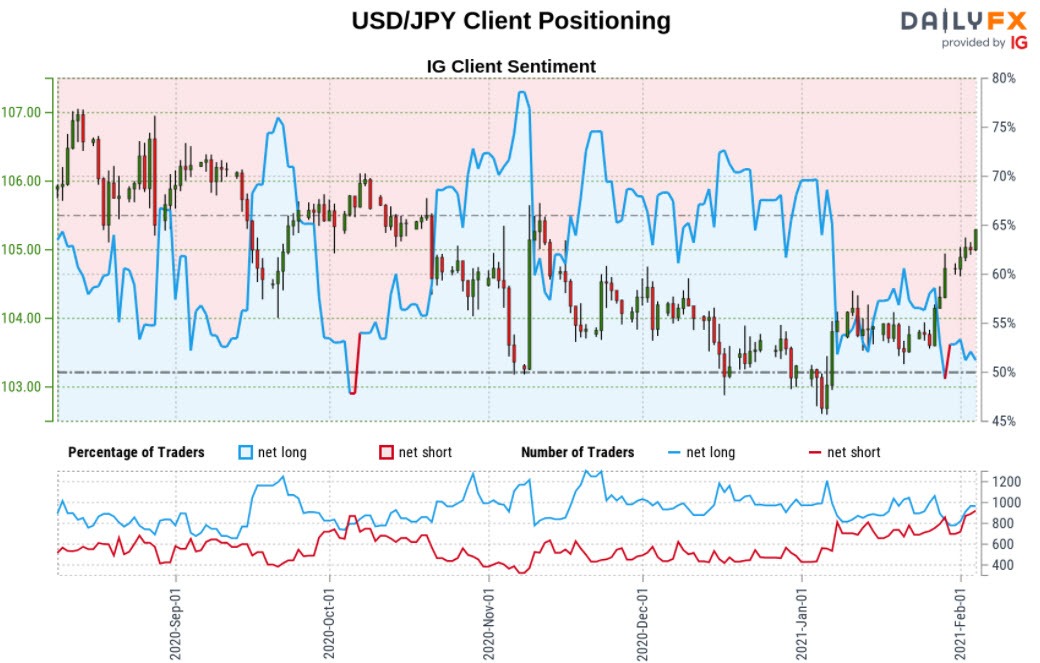
- A summary of IG Client Sentiment shows traders are net-long USD/JPY - the ratio stands at +1.15 (53.38% of traders are long) – neutral reading
- Long positions are3.17% lower than yesterday and 11.00% higher from last week
- Short positions are 3.72% lower than yesterday and 0.12% lower from last week
- We typically take a contrarian view to crowd sentiment, and the fact traders are net-long suggests USD/JPY prices may continue to fall. Traders are further net-long than yesterday and last week, and the combination of current positioning and recent changes gives us a stronger USD/JPY-bearish contrarian trading bias from a sentiment standpoint.
| Change in | Longs | Shorts | OI |
| Daily | -17% | -2% | -4% |
| Weekly | -6% | 4% | 2% |
---
Key US / Japan Data Releases

Economic Calendar - latest economic developments and upcoming event risk.
Previous Weekly Technical Charts
- Crude Oil (WTI)
- Gold (XAU/USD)
- US Dollar (DXY)
- Australian Dollar (AUD/USD)
- Canadian Dollar (USD/CAD)
- Sterling (GBP/USD)
- Euro (EUR/USD)

--- Written by Michael Boutros, Technical Currency Strategist with DailyFX
Follow Michael on Twitter @MBForex


