


US Dollar Technical Price Outlook: DXY Weekly Trade Levels
- US Dollar technical trade level update – Weekly Chart
- USD mounts largest offensive since September- recovery eyes downtrend resistance
- DXY Initial weekly resistance into 91, Bearish invalidation 92.28
The US Dollar Index rallied more than 0.6% this week marking the second consecutive weekly advance. The early-month rebound is the first major counteroffensive since September and although more gains are likely near-term, the index remains within the confines of a broader bearish formation – looking for guidance on a test of resistance in the week ahead. These are the updated technical targets and invalidation levels that matter on the US Dollar Index weekly price chart. Review my latest Weekly Strategy Webinar for an in-depth breakdown of this DXY technical setup and more.
US Dollar Index Price Chart – DXY Weekly
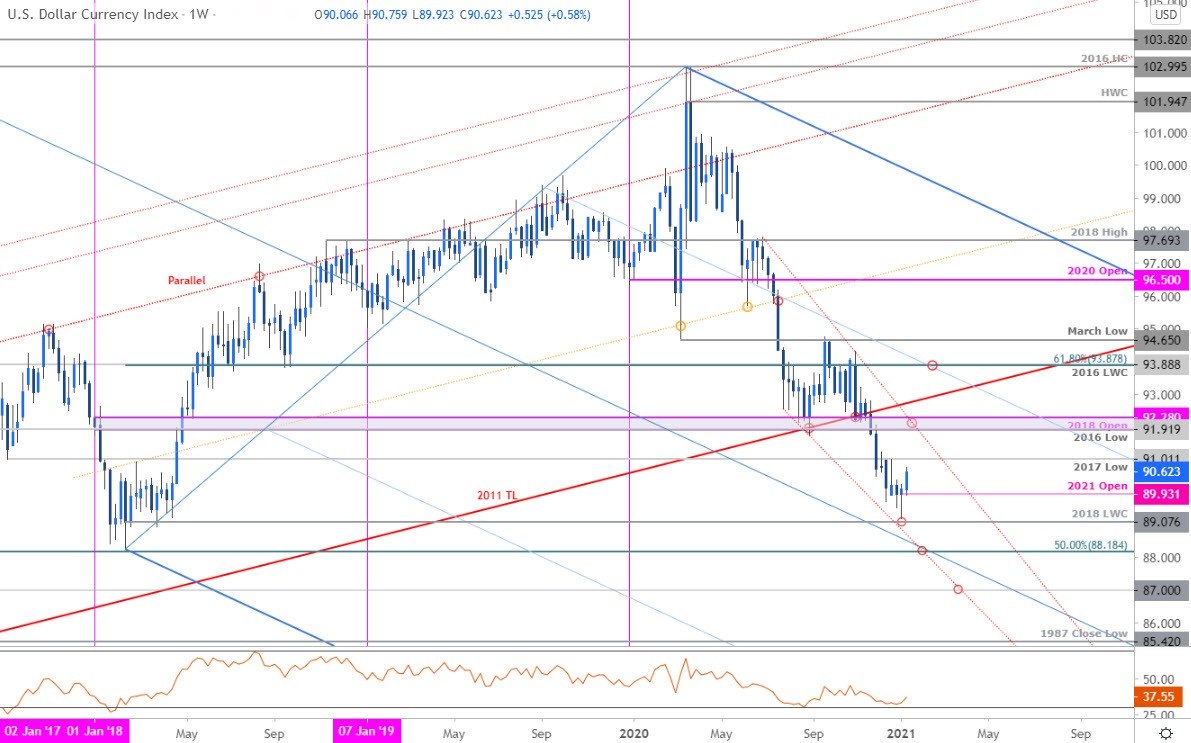
Chart Prepared by Michael Boutros, Technical Strategist; US Dollar Index on Tradingview
Notes: In last month’s US Dollar Weekly Price Outlook we noted that the DXY, “breakdown may be stalling here at longer-term downtrend support and the immediate decline may be vulnerable in the days ahead while above the median-line (blue)… be on the lookout for downside exhaustion ahead of 89.07IF a near-term recovery is in the cards.” The Dollar registered a low at 89.20 on building momentum divergence before reversing with the subsequent rally now poised to mark the second consecutive weekly advance.
Initial weekly resistance eyed at the 2017 swing low at 91.01 backed by broader bearish invalidation at the 91.91-92.28 confluence zone- a region defined by the 2016 low / 2018 yearly open and converges on the June trendline. A breach / weekly close above this threshodl would be needed to suggest a more significant low is in place. Downside support levels are unchanged at the 2018 low-week close at 89.07 and the 50% retracement of the 2011 ascent / 2018 low at 88.18/25 – risk for accelerated losses below this level.
For a complete breakdown of Michael’s trading strategy, review his Foundations of Technical Analysis series on Building a Trading Strategy
Bottom line: The US Dollar is poised to mark the first consecutive weekly rally since September after rebounding just ahead of confluence downtrend support. From at trading standpoint, look to reduce long-exposure / raise protective stops on a stretch towards the upper parallel – pullbacks should be limited by objective yearly open support at 89.93IF price is indeed heading higher. Ultimately, the recovery remains within the confines of a broader descending consolidation pattern and we’re on the lookout for a breakout in the weeks ahead for further guidance on our medium-term directional bias.

Key US Data Releases
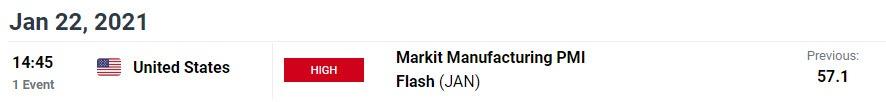
Economic Calendar - latest economic developments and upcoming event risk.
Previous Weekly Technical Charts
- Australian Dollar (AUD/USD)
- Canadian Dollar (USD/CAD)
- Sterling (GBP/USD)
- Euro (EUR/USD)
- Crude Oil (WTI)
- Gold (XAU/USD)
--- Written by Michael Boutros, Technical Strategist with DailyFX
Follow Michael on Twitter @MBForex


