


Gold Technical Price Outlook: XAU/USD Weekly Trade Levels
- Gold price updated technical trade levels - Weekly Chart
- XAU/USD rally accelerates into 2021 open – breakout constructive while above 1898
- New to Gold Trading? Get started with this Free How to Trade Gold -Beginners Guide
Gold prices have surged more than 2.6% into the 2021 open with a breakout in XAU/USD soaring to multi-week highs. The rally takes gold into the first major objective at Fibonacci resistance and we’re looking for inflection here in the coming days for guidance. These are the updated targets and invalidation levels that matter on the gold weekly charts heading into the Georgia Senate run-off elections and US Non-Farm payrolls later this week. Review my latest Weekly Strategy Webinar for an in-depth breakdown of this gold technical setup and more.
Gold Price Chart - XAU/USD Weekly
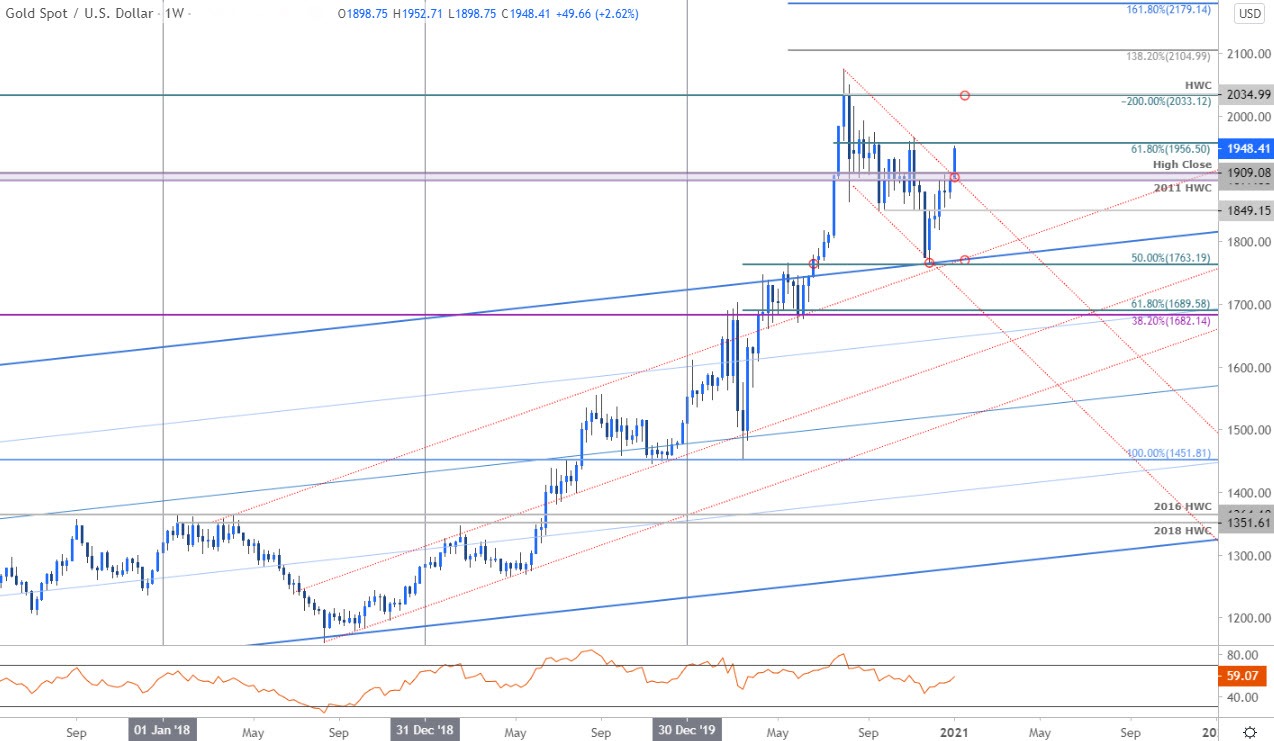
Chart Prepared by Michael Boutros, Technical Strategist; Gold on Tradingview
Notes: In my last Gold Weekly PriceOutlook we noted that the XAU/USD, “recovery off confluence support is entering its third week and challenging the first lateral resistance level at 1849- watch the weekly close with respect to this threshold.” A topside breach into the close of the year fueled a rally into downtrend resistance at the 2011 high-week close / high-close at 1898-1909- this level is being challenged into the 2021 open with a breakout early in the week keeping the immediate focus higher in gold.
The rally is now approaching the first major resistance objective at the 61.8% Fibonacci retracement of the August decline / November high at 1956/65- a breach / close above this threshold is needed to keep the immediate long-bias viable towards subsequent topside objectives at the 200% ext / high-week close at 2033/35. Weekly support now rests back at the yearly open at 1898 with a close below 1849 needed to once again threaten key support at 1763.

Bottom line: The gold price breakout is already approaching the first major resistance objective and the focus is on possible inflection off this threshold. From a trading standpoint, look to reduce long-exposure / raise protective stops on a test of 1956 – be on the lookout for downside exhaustion ahead of 1898 on pullbacks IF price is indeed heading higher with a breach here exposing the record high-week close. Stay nimble into the monthly open here with major event-risk likely to fuel increased volatility in the days ahead. Review my latest Gold Price Outlook for a closer look at the near-term XAU/USD technical trading levels.
For a complete breakdown of Michael’s trading strategy, review his Foundations of Technical Analysis series on Building a Trading Strategy
Gold Trader Sentiment – XAU/USD Price Chart
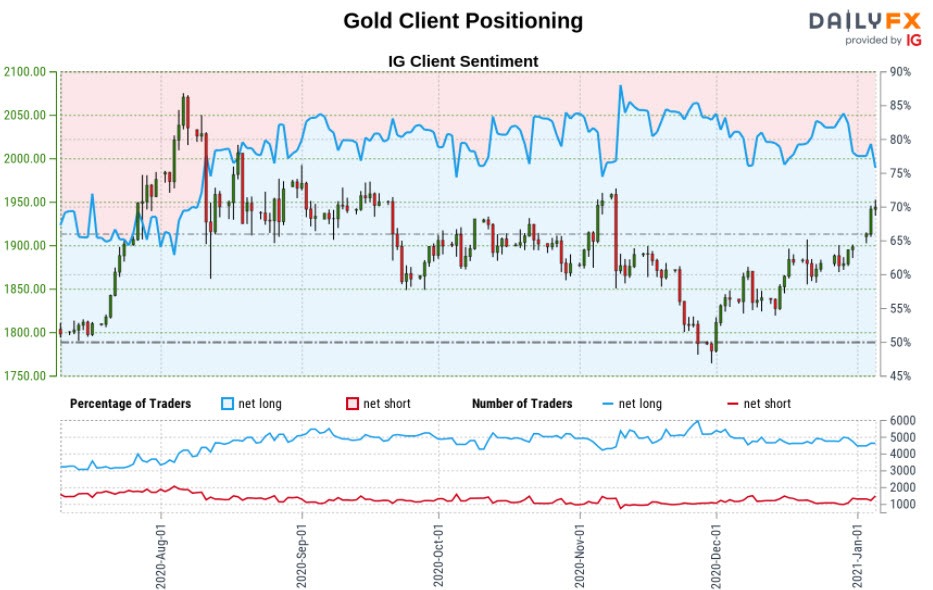
- A summary of IG Client Sentiment shows traders are net-long Gold- the ratio stands at +3.28 (76.62% of traders are long) – typically bearishreading
- Long positions are1.44% higher than yesterday and 4.82% lower from last week
- Short positions are1.73% higher than yesterday and 39.89% higher from last week
- We typically take a contrarian view to crowd sentiment, and the fact traders are net-long suggests Gold prices may continue to fall. Yet traders are less net-long than yesterday and compared with last week. Recent changes in sentiment warn that the current Gold price trend may soon reverse higher despite the fact traders remain net-long.
| Change in | Longs | Shorts | OI |
| Daily | -2% | -3% | -2% |
| Weekly | 9% | -14% | -4% |
---
Previous Weekly Technical Charts
- Written by Michael Boutros, Currency Strategist with DailyFX
Follow Michael on Twitter @MBForex


