


Sterling Technical Price Outlook: GBP/USD Weekly Trade Levels
- Sterling technical trade level update – Weekly Chart
- GBP/USD rally falters at confluence resistance / threat for deeper correction into January
- Initial weekly support 1.3495, 1.3250–critical resistance steady at 1.3675
The British Pound snapped a three-week advance against the US Dollar with GBP/USD reversing off confluence technical resistance to close lower by 0.86% on Friday. The reversal threatens a larger Cable correction within the confines of the broader May advance and we’re looking for possible infection off this key pivot zone heading deeper into January trade. These are the updated targets and invalidation levels that matter on the GBP/USD weekly technical chart. Review my latest Strategy Webinar for an in-depth breakdown of this Cable trade setup and more.
Sterling Price Chart - GBP/USD Weekly

Chart Prepared by Michael Boutros, Technical Strategist; GBP/USD on Tradingview
Notes:In my last Sterling Weekly Price Outlook we noted that, “be on the lookout for a reaction on a move lower towards uptrend support for guidance – ultimately, losses should be limited to the 1.30-handle IF Cable is indeed heading higher on this stretch.” Cable registered a low at 1.3188 in the days that followed before surging higher with the rally halting at confluence resistance into the start of the year at 1.3621/75- a region defined by the 38.2% Fibonacci retracement of the 2014 decline / the 2016 Brexit gap and converges on basic trendline resistance extending off the march 2020 high. A breach / weekly close above this threshold is needed to keep the advance viable heading deeper into January.
Initial weekly support rests at the 2017 high-week reversal close at 1.3494 backed the 61.8% retracement / 2020 yearly open at 1.3245/50 and 1.3164- both zones of interest for possible downside exhaustion IF reached. Ultimately, a topside breach / weekly close above 1.3675 is needed to validate a larger Sterling breakout with such a scenario exposing subsequent resistance objectives at the 2018 high-week close at 1.3997 and the 50% retracement / 20178 high at 1.4303/77.
For a complete breakdown of Michael’s trading strategy, review his Foundations of Technical Analysis series on Building a Trading Strategy
Bottom Line:The Sterling rally has stalled at confluence trend resistance into the start of the year. From a trading standpoint, the threat for a larger correction remains while below 1.3675 – ultimately a larger pullback may offer more favorable opportunities closer to uptrend support. Its important to note the technical significance of this resistance threshold – expect substantial acceleration in the event of a topside breach here.I’ll publish an updated Sterling Price Outlook once we get further clarity on the near-term GBP/USD technical trade levels.

Sterling Trader Sentiment - GBP/USD Price Chart

- A summary of IG Client Sentiment shows traders are net-short GBP/USD - the ratio stands at –1.05 (48.90% of traders are long) – neutral reading
- Long positions are9.99% higher than yesterday and 43.00% higher from last week
- Short positions are0.12% lower than yesterday and 15.86% lower from last week
- We typically take a contrarian view to crowd sentiment, and the fact traders are net-short suggests GBP/USD prices may continue to rise. Yet traders are less net-short than yesterday and compared with last week. Recent changes in sentiment warn that the current GBP/USD price trend may soon reverse lower despite the fact traders remain net-short.
| Change in | Longs | Shorts | OI |
| Daily | 2% | 16% | 6% |
| Weekly | 8% | 2% | 6% |
---
Key UK / US Economic Data Releases
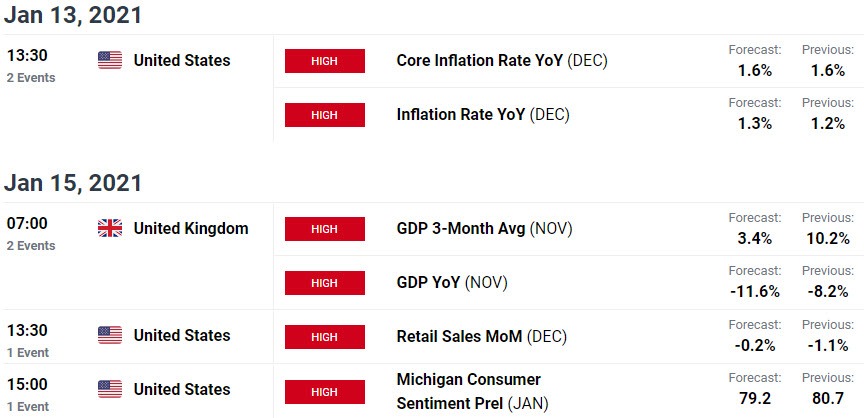
Economic Calendar - latest economic developments and upcoming event risk.
Previous Weekly Technical Charts

--- Written by Michael Boutros, Technical Currency Strategist with DailyFX
Follow Michael on Twitter @MBForex


