


US Dollar Technical Price Outlook: DXY Weekly Trade Levels
- US Dollar technical trade level update – Weekly Chart
- USD sell-off extends into yearly open- threat for exhaustion into trend support / 89.07
- DXY Initial weekly resistance into 91- threat remains lower sub-92.28
The US Dollar Index has plunged more than 5.8% off the September highs with the DXY breakdown carrying over into the yearly open. The sell-off may be losing steam here however as price responds to long-term downtrend support and while the broader outlook remains tilted to the downside, the immediate decline may be vulnerable here. These are the updated technical targets and invalidation levels that matter on the US Dollar Index weekly price chart amid the ongoing chaos on Capitol Hill and heading into Non-Farm Payrolls tomorrow. Review my latest Strategy Webinar for an in-depth breakdown of this DXY technical setup and more.
US Dollar Index Price Chart – DXY Weekly
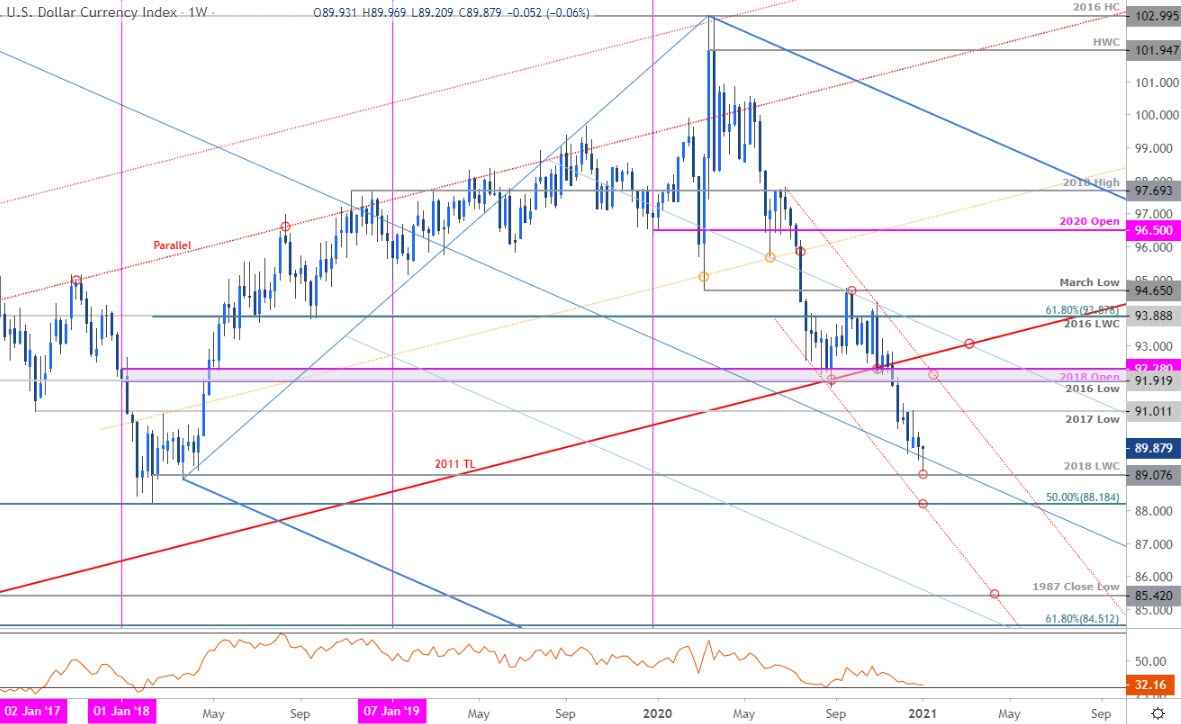
Chart Prepared by Michael Boutros, Technical Strategist; US Dollar Index on Tradingview
Notes: In last month’s US Dollar Weekly Price Outlook we noted that DXY had, “broken major uptrend support and keeps the outlook weighted to the downside heading into the close of the year.” The index dropped more than 1.55% in the following weeks the price falling to fresh multi-year lows into the 2021 open. The decline turned just pips ahead of the 2018 low-week reversal close at 89.07 before stalling with DXY virtually unchanged for the week heading into Friday.
Initial weekly resistance stands at 91.01 backed by the confluence zone at 91.92-92.28- a region defined by the 2016 low / 2018 yearly open and converges on the June trendline. Ultimately, a breach / weekly close above this threshold is needed to suggest a larger price reversal is underway in the greenback. A close below the 89.07 support zone would be needed to keep the immediate short-bias viable towards subsequent objectives at the 50% retracement of the 2011 ascent / 2018 low at 88.18/25 - look for a larger reaction there IF reached.
For a complete breakdown of Michael’s trading strategy, review his Foundations of Technical Analysis series on Building a Trading Strategy
Bottom line: The US Dollar breakdown may be stalling here at longer-term downtrend support and the immediate decline may be vulnerable in the days ahead while above the median-line (blue). From a trading standpoint, a good zone to reduce short-exposure / lower protective stops – be on the lookout for downside exhaustion ahead of 89.07IF a near-term recovery is in the cards. Ultimately, a larger rebound may offer more favorable opportunities closer to downtrend resistance.

Key US Data Releases
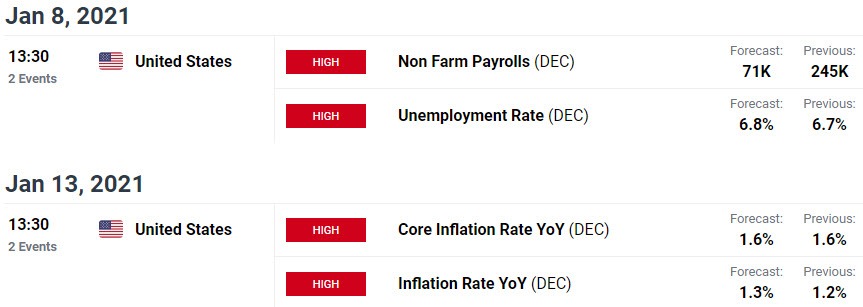
Economic Calendar - latest economic developments and upcoming event risk.
Previous Weekly Technical Charts
- Euro (EUR/USD)
- Crude Oil (WTI)
- Gold (XAU/USD)
- Australian Dollar (AUD/USD)
- Canadian Dollar (USD/CAD)
- Sterling (GBP/USD)
--- Written by Michael Boutros, Technical Strategist with DailyFX
Follow Michael on Twitter @MBForex


