


Canadian Dollar Technical Price Outlook: USD/CAD Weekly Trade Levels
- Canadian Dollar updated technical trade levels - Weekly Chart
- USD/CAD rebounds off confluence downtrend support – risk for near-term recovery
- Resistance / bearish invalidation at 1.3056 - Critical support steady at 1.2579-1.2619
The Canadian Dollar is down more than 0.6% against the US Dollar into the weekly open with USD/CAD building on a recovery off downtrend support last week. Is this just a bear market rally or is a larger reversal underway? These are the updated targets and invalidation levels that matter on the USD/CAD weekly technical price chart heading into the start of the week. Review my latest Strategy Webinar for an in-depth breakdown of this Loonie technical setup and more.
Canadian Dollar Price Chart – USD/CAD Weekly
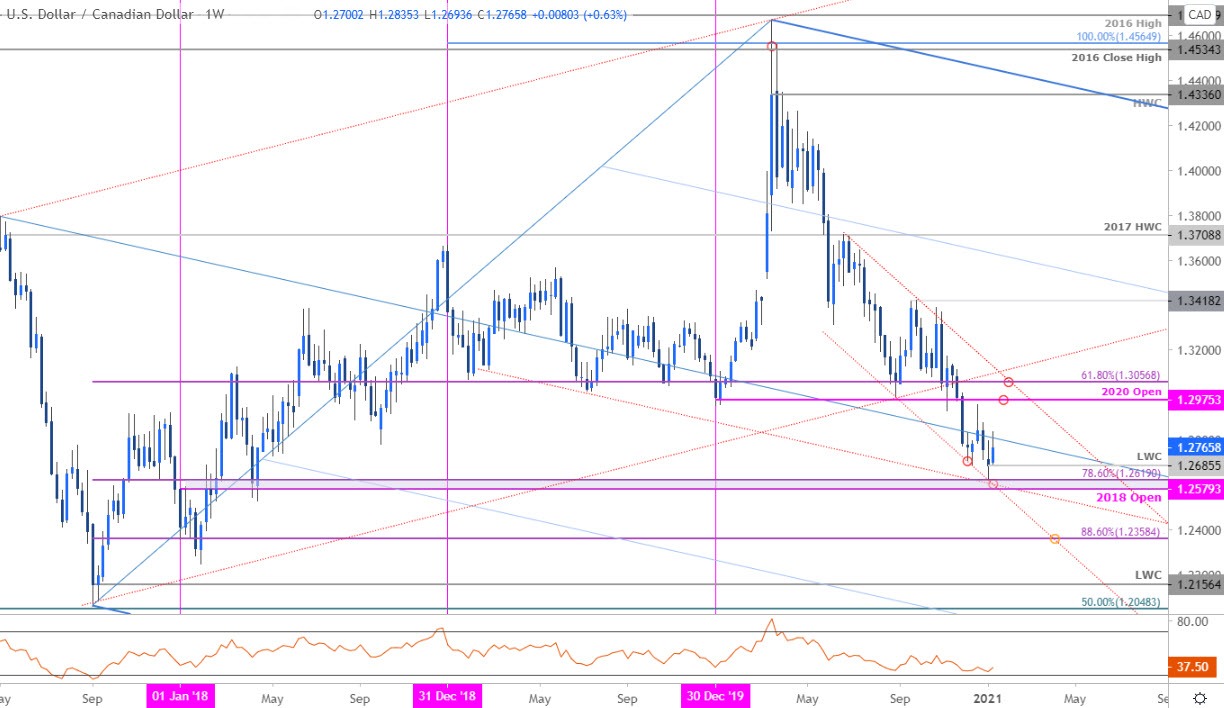
Chart Prepared by Michael Boutros, Technical Strategist; USD/CAD on Tradingview
Notes: In my last Canadian Dollar Weekly Price Outlook we noted the risk for continued USD/CAD weakness into the yearly open while highlighting key, “confluence support at the 2018 yearly open / 78.6% Fibonacci retracement of 2017 advance at 1.2579-1.2619 – look for a larger reaction there IF reached.” Price registered a low at 1.2629 last week before rebounding- so is a more near-term low in?
Initial weekly resistance eyed at the objective 2020 yearly open at 1.2975 backed the 61.8% retracement / channel resistance at 1.3057 – a breach / weekly close above this confluence zone is needed to suggest a more significant low is in place. Key support remains unchanged with a weekly close below 1.2579 ultimately needed to mark resumption of the broader downtrend towards the 1.24-handle and 1.2358.

Bottom line: The USD/CAD breakdown may be losing steam here as price responds to confluence downtrend support. From a trading standpoint, the threat for a larger recovery remains while above 1.2579 – be on the lookout for possible topside exhaustion ahead of 1.3057 IF price is indeed heading lower. Review my latest Canadian Dollar Price Outlook for a closer look at the near-term USD/CAD technical trade levels.
For a complete breakdown of Michael’s trading strategy, review his Foundations of Technical Analysis series on Building a Trading Strategy
Canadian Dollar Trader Sentiment – USD/CAD Price Chart

- A summary of IG Client Sentiment shows traders are net-long USD/CAD - the ratio stands at +1.78 (64.05% of traders are long) – typically bearish reading
- Long positions are 7.33% lower than yesterday and 10.17% lower from last week
- Short positions are29.75% higher than yesterday and 11.73% higher from last week
- We typically take a contrarian view to crowd sentiment, and the fact traders are net-long suggests USD/CAD prices may continue to fall. Yet traders are less net-long than yesterday and compared with last week. Recent changes in sentiment warn that the current USD/CAD price trend may soon reverse higher despite the fact traders remain net-long.
| Change in | Longs | Shorts | OI |
| Daily | -2% | 7% | 5% |
| Weekly | -30% | 38% | 13% |
---
US / Canada Economic Calendar
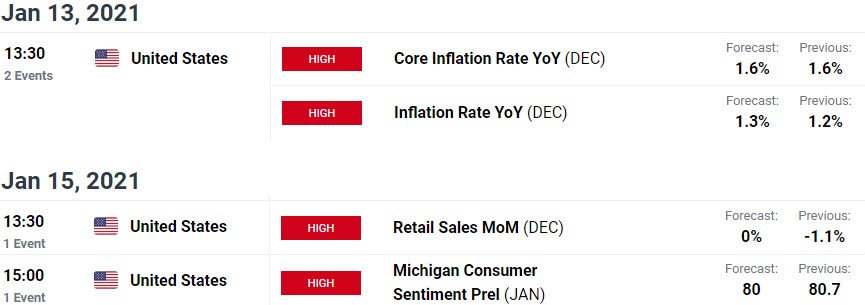
Economic Calendar - latest economic developments and upcoming event risk.
Previous Weekly Technical Charts
- Sterling (GBP/USD)
- US Dollar (DXY)
- Euro (EUR/USD)
- Crude Oil (WTI)
- Gold (XAU/USD)
- Australian Dollar (AUD/USD)
--- Written by Michael Boutros, Technical Currency Strategist with DailyFX
Follow Michael on Twitter @MBForex


