


Crude Oil Technical Forecast: WTI Weekly Trade Levels
- Crude Oil updated technical trade levels – Daily & Intraday Charts
- WTI threatens major breakout 2019 highs / constructive while above 64.65
- New to Oil Trading? Get started with this Free How to Trade Oil-Beginners Guide
Oil prices surged more than 4.5% off the weekly lows with the WTI threatening a major breakout at resistance into the monthly range / 2019 swing highs. We’re looking for a reaction here with a breach / close above needed to keep the immediate advance viable in the days ahead. These are the updated targets and invalidation levels that matter on the oil price weekly chart. Review my latest Strategy Webinar for an in-depth breakdown of this crude oil price setup and more.
Crude Oil Price Chart – WTI Daily
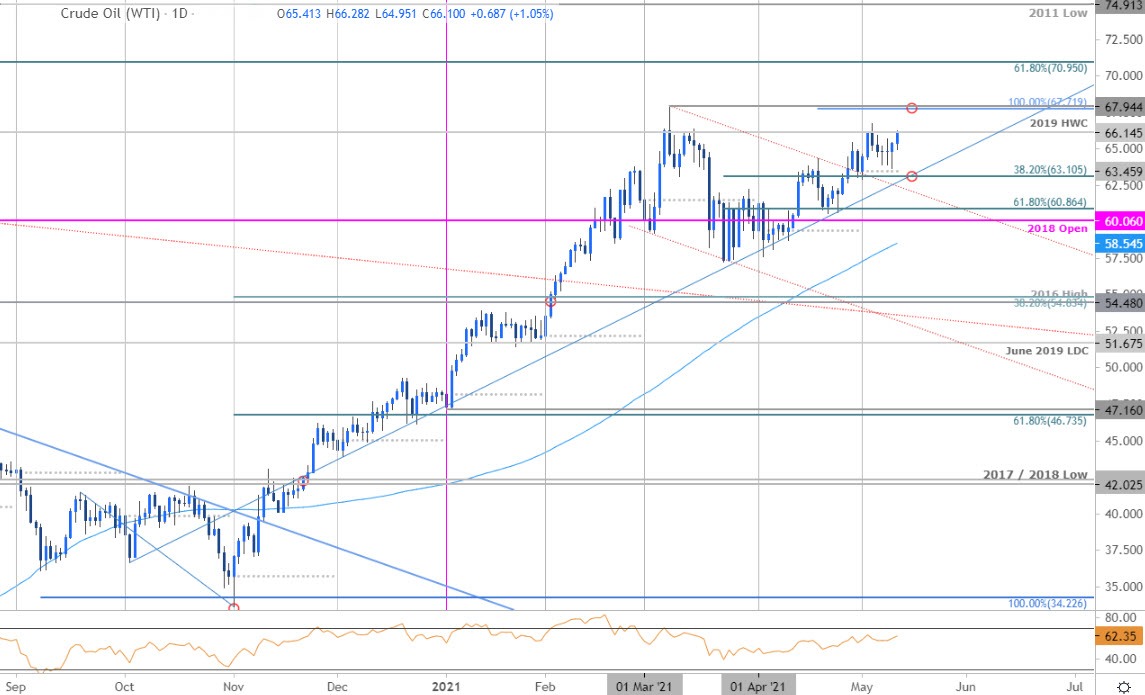
Chart Prepared by Michael Boutros, Technical Strategist; Crude Oil (WTI) on Tradingview
Technical Outlook: In last month’s Crude Oil Price Outlook we noted that WTI was approaching confluence resistance near the 64-handle and be on the lookout, “for possible inflection off this zone with a breach / close above needed to keep the immediate advance viable towards the 2019 high-week close / 2021 high close at 66.14/26.” Crude prices registered a high at 64.35 before posting an outside-day reversal lower with the pullback rebounding off confluence support into the close of April.
Crude prices have rallied more than 10% off that low with the advance now probing key resistance at 66.14/26- looking for a reaction up here. A topside breach / close above would be needed to keep the immediate long-bias viable towards subsequent objectives at the 100% extension / 2021 yearly high at 67.72/94 and the 61.8% Fibonacci retracement of the 2011 decline at 70.95. Key daily support / bullish invalidation rest with the 38.2% retracement / monthly open at 63.10/45.
Crude Oil Price Chart – WTI 120min

Notes: A closer look at Crude price action shows WTI trading within the confines of an ascending pitchfork formation extending off the March / April low with price turning this week just ahead of the lower parallels. A breakout of the weekly opening-range on Wednesday has fueled a rally back into key resistance at the 2019 high-week / high-day close / 2019 high at 66.15/57- look for a reaction into this zone with a close above needed to keep the rally viable into the close of the week. Initial support 65.56 backed by near-term bullish invalidation at the yearly high-day reversal-close at 64.65. Ultimately a break / close below 63.10 would be needed to put the bears in control.

Bottom line: The crude oil rally is now testing key resistance into the May opening-range highs. From at trading standpoint, a good region to reduce long-exposure / raise protective stops – losses should be limited by 64.65 IF price is indeed heading higher with a close above 66.57 needed to fuel the next leg higher. Keep in mind this is a major resistance zone we’ve been tracking for months now – a breach could fuel another accelerated run for the bulls- stay nimble here. Review my latest Crude Oil Weekly Price Outlook for a closer look at the longer-term technical trading levels.
For a complete breakdown of Michael’s trading strategy, review his Foundations of Technical Analysis series on Building a Trading Strategy
Crude Oil Trader Sentiment – WTI Price Chart

- A summary of IG Client Sentiment shows traders are net-long crude oil - the ratio stands at +1.20 (54.60% of traders are long) – typically bearish reading
- Long positions are 11.25% lower than yesterday and 13.31% higher from last week
- Short positions are9.57% higher than yesterday and 24.91% lower from last week
- We typically take a contrarian view to crowd sentiment, and the fact traders are net-long suggests Oil - US Crude prices may continue to fall. Yet traders are less net-long than yesterday but more net-long from last week and the combination of current positioning and recent changes gives us a further mixed Oil - US Crude trading bias from a sentiment standpoint.
| Change in | Longs | Shorts | OI |
| Daily | -13% | 2% | -9% |
| Weekly | 8% | -26% | -5% |
---
Active Technical Setups
- S&P 500 Price Outlook: Bull-Market Correction or More? CPI on Tap
- Canadian Dollar Outlook: USD/CAD May Plunge- Loonie Breakout Levels
- Gold Price Outlook: Gold Breakout Imminent – XAU/USD Levels for NFP
- Australian Dollar Outlook: AUD/USD Plunges into Multi-Month Support

--- Written by Michael Boutros, Technical Strategist with DailyFX
Follow Michael on Twitter @MBForex


