


Australian Dollar Technical Price Outlook: AUD/USD Weekly Trade Levels
- Australian Dollar technical trade level update - Weekly Chart
- AUD/USD sell-off plunges into multi-month uptrend support / 2021 range low
- Aussie key support into 7563– key resistance steady at 7836
The Australian Dollar plummeted nearly 6% against the US Dollar off the February highs with the decline now testing multi-month channel support. While the broader outlook remains constructive, the rally remains vulnerable here as the April range sets up just above the yearly lows. These are the updated targets and invalidation levels that matter on the AUD/USD weekly price chart heading into the close of the year. Review my latest Weekly Strategy Webinar for the an in-depth breakdown of this Aussie technical setup and more.
Australian Dollar Price Chart – AUD/USD Weekly

Chart Prepared by Michael Boutros, Technical Strategist; AUD/USD on Tradingview
Notes: In last month’s Australian Dollar Weekly Price Outlook we noted that a pivot back below the objective yearly open, “now risks a deeper March correction with the AUD/USD price reversal approaching multi-month uptrend support. From a trading standpoint, look to reduce short exposure / lower protective stops on a stretch towards 7563 / channel support- keep an eye for a larger reaction there IF reached.” Aussie plunged into this threshold into the April open with price briefly registering an intraday low at 7531 before rebounding- the focus now falls onto the monthly opening-range which is being carved out just above multi-month uptrend support / the yearly range lows.
Weekly resistance now stands back at 7701 with bearish invalidation at the 2018 yearly open / 88.6% Fibonacci retracement at 7801/36. Weekly support steady at 7563- a break / close below would be needed to suggest a larger Aussie correction is underway with such a scenario exposing the May 2017 low-week close / 23.6% retracement at 7385-7417.

Bottom line: The Australian Dollar has carved a well-defined monthly range just above trendline support and the immediate focus is on a breakout of the April range for guidance. From a trading standpoint, look for topside exhaustion ahead of the 77-handle IF price is indeed heading lower with a close below 7563 needed to fuel the next leg lower in Aussie. Ultimately, a breach above 7836 would be needed to mark resumption of the broader uptrend / re-assert the long-bias. I’ll publish an updated Australian Dollar Price Outlook once we get further clarity on the near-term AUD/USD technical trade levels.
For a complete breakdown of Michael’s trading strategy, review his Foundations of Technical Analysis series on Building a Trading Strategy
Australian Dollar Trader Sentiment – AUD/USD Price Chart

- A summary of IG Client Sentiment shows traders are net-short AUD/USD - the ratio stands at +1.01 (50.17% of traders are long) – neutralreading
- Long positions are 6.62% higher than yesterday and 0.25% lower from last week
- Short positions are13.64% higher than yesterday and 9.69% higher from last week
- We typically take a contrarian view to crowd sentiment, and the fact traders are net-long suggests AUD/USD prices may continue to fall. Yet traders are less net-long than yesterday and compared with last week. Recent changes in sentiment warn that the current AUD/USD price trend may soon reverse higher despite the fact traders remain net-long.
| Change in | Longs | Shorts | OI |
| Daily | 2% | 3% | 2% |
| Weekly | 29% | -46% | 0% |
---
Key Australia / US Data Releases
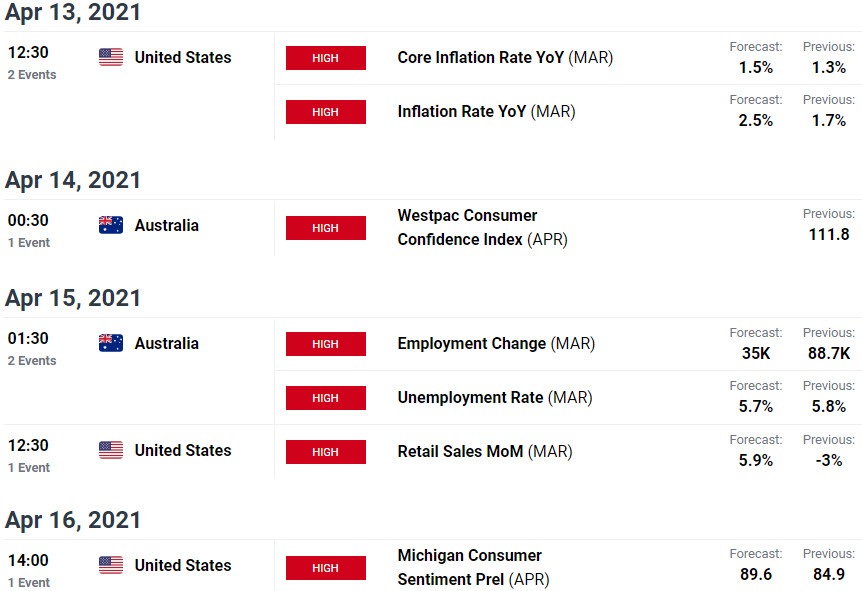
Economic Calendar - latest economic developments and upcoming event risk.
Previous Weekly Technical Charts
- Sterling (GBP/USD)
- Japanese Yen (USD/JPY)
- New Zealand Dollar (NZD/USD)
- Gold (XAU/USD)
- Canadian Dollar (USD/CAD)
- US Dollar Index (DXY)
- Euro (EUR/USD)
--- Written by Michael Boutros, Technical Currency Strategist with DailyFX
Follow Michael on Twitter @MBForex


