


AUD/USD, AUD/JPY, EUR/AUD: AUSTRALIAN DOLLAR IN FOCUS AHEAD OF JOBS DATA DUE
- AUD price action will eye upcoming Australian employment data due for release early during Thursday’s trading session at 00:30 GMT
- The Australian Dollar stands to swing in response to changes in RBA rate cut expectations as forex market participants react to the Australian jobs report
- Check out the IG Client Sentiment Report for real-time insight on changes in trader positioning
The Australian Dollar comes into focus with Australian employment change and unemployment rate data for September set to cross the wires early Thursday at 00:30 GMT. Although the RBA has cut its benchmark interest rate – the overnight cash rate (OCR) – to an all-time low of 0.75% earlier this month, the central bank stated in its monetary policy decision press release that “It is reasonable to expect that an extended period of low interest rates will be required in Australia to reach full employment and achieve the inflation target.”
The RBA added that the Governing Board will “continue to monitor developments, including in the labour market, and is prepared to ease monetary policy further if needed to support sustainable growth in the economy, full employment and the achievement of the inflation target over time.” Consequently, high-impact economic data like Thursday’s release of Australian employment data has potential to materially sway the market’s expectations for more RBA rate cuts and Australian Dollar price action in turn.
AUSTRALIAN EMPLOYMENT CHANGE & UNEMPLOYMENT RATE
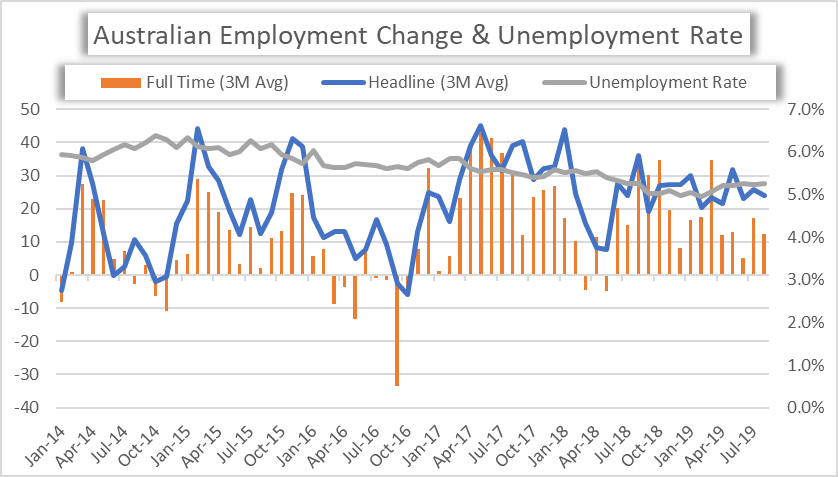
While the prior Australian jobs report topped the median economist estimate of 15K for the headline figure with a total 34.7K total jobs added, the details of the employment data were much less inspiring. The trend in both total employment change – and more importantly full time employment change – seem to be heading lower while the Australian unemployment rate has recently ticked higher to 5.3%.
That said, the RBA could be swayed to cut interest rates yet again as the central bank further loosens financial conditions to soak up excess slack in the Australian labor market if the September jobs report disappoints. On the other hand, early signs that the US-China trade war could be taking a turn for the better following the recent ‘phase 1 trade agreement’ between the two economic powerhouses touted by President Trump combined with another overall healthy Australian jobs report could keep additional RBA interest rate cuts at bay (at least for the time being).
RESERVE BANK OF AUSTRALIA (RBA) INTEREST RATE TARGET PROBABILITIES (DECEMBER 2019)
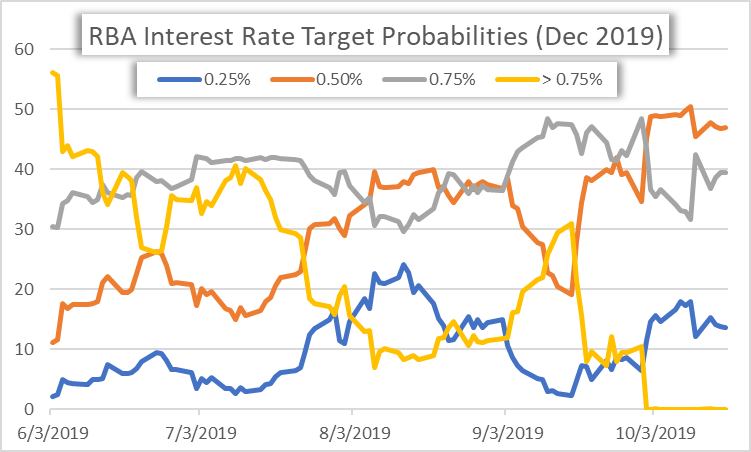
According to the latest pricing of overnight swaps, markets are estimating a rough 60% probability that the Reserve Bank of Australia cuts the OCR again from its current 0.75% target before year-end. There is a 47.0% chance that the central bank’s policy interest rate will be cut by 25-basis points, a 13.6% chance of the OCB being lowered by 50-basis points and a 39.4% priced probability that the RBA leaves rates unchanged through December.
AUSTRALIAN DOLLAR IMPLIED VOLATILITY & TRADING RANGES

Ultimately, the uncertainty and risk surrounding a high-impact economic data release – like the Australia employment change – typically bids up implied volatility. AUD/USD overnight implied volatility of 9.22% is above its 20-day average of 7.23% and ranks in the top 80th percentile of readings taken over the last 6-months. AUD/JPY overnight implied volatility of 11.09% is above its 20-day average of 9.41% and ranks in the top 70th percentile of readings taken over the last 6-months.
EUR/AUD overnight implied volatility of 8.79% is above its 20-day average of 7.05% and ranks in the top 80th percentile of readings taken over the last 6-months. GBP/AUD is expected to be the most volatile Australian Dollar currency pair during Thursday’s trading session with an overnight implied volatility of 23.64% as the EU and UK scramble to reach a Brexit deal. Implied trading ranges are calculated with a 68% statistical probability and indicates a 1-standard deviation move from spot estimated with the latest overnight implied volatility reading.
AUD/USD PRICE CHART: DAILY TIME FRAME (JULY 08, 2019 TO OCTOBER 16, 2019)

The rebound in AUD/USD since the start of the month owing largely to US-China trade talk optimism seems to be running out of steam. The Australian Dollar’s broad downtrend highlighted by the lower swing highs printed on July 18 and September 12 could setup spot AUD/USD for a retest of multi-year lows beneath the 0.6700 price level.
This bearish scenario would likely warrant greater credence if the September Australian Jobs data disappoints since the currency pair has pivoted back below confluent support provided by its 23.6% Fibonacci retracement and 50-day simple moving average. Conversely, aside from support-turned-resistance, the 0.6800 handle and month-to-date swing high could keep a lid on a potential upside.
AUD/JPY PRICE CHART: DAILY TIME FRAME (JUNE 16, 2019 TO OCTOBER 16, 2019)
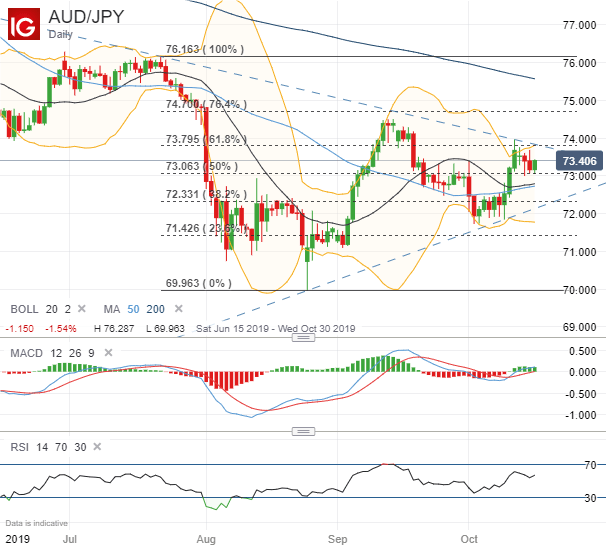
AUD/JPY has also attempted to stage a rebound this month but the sentiment-geared currency pair appears to be forming a wedge pattern between rising and falling trendlines. Seeing that the Aussie-Yen is a commonly used forex pair for carry trades, AUD/JPY price action is particularly sensitive to changes in interest rate expectations.
In turn, it is possible that a healthy Australian employment report could squash RBA rate cut bets and propel AUD/JPY above the descending trendline, but technical resistance also posed by the 61.8% Fibonacci retracement and 74.000 handle could hinder upward moves. Looking lower underpins the 20-day and 50-day simple moving averages as technical support in addition to the mid-point retracement of AUD/JPY’s steep slide during July and into August.
EUR/AUD PRICE CHART: DAILY TIME FRAME (JUNE 13, 2019 TO OCTOBER 16, 2019)
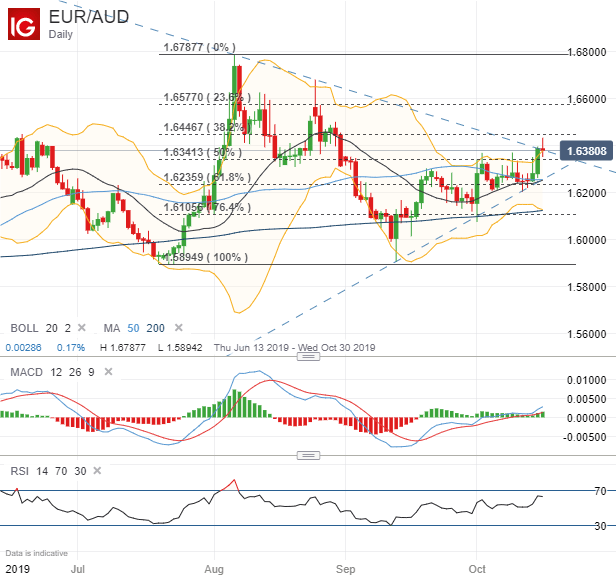
EUR/AUD could be breaking out above its downtrend resistance line extended from the lower highs recorded on August 6 and August 25. With the EU Summit underway and Brexit headlines crossing the wires, spot EUR/AUD price action could be particularly volatile. A possible upside target could be the 38.2% Fib. Technical support could be looked to around the mid-point retracement of the currency pair’s trading range since mid-July as well as its 50-day SMA, 61.8% Fib and uptrend line connecting the series of higher lows printed since September.
-- Written by Rich Dvorak, Junior Analyst for DailyFX.com
Connect with @RichDvorakFX on Twitter for real-time market insight


