


Summary Table
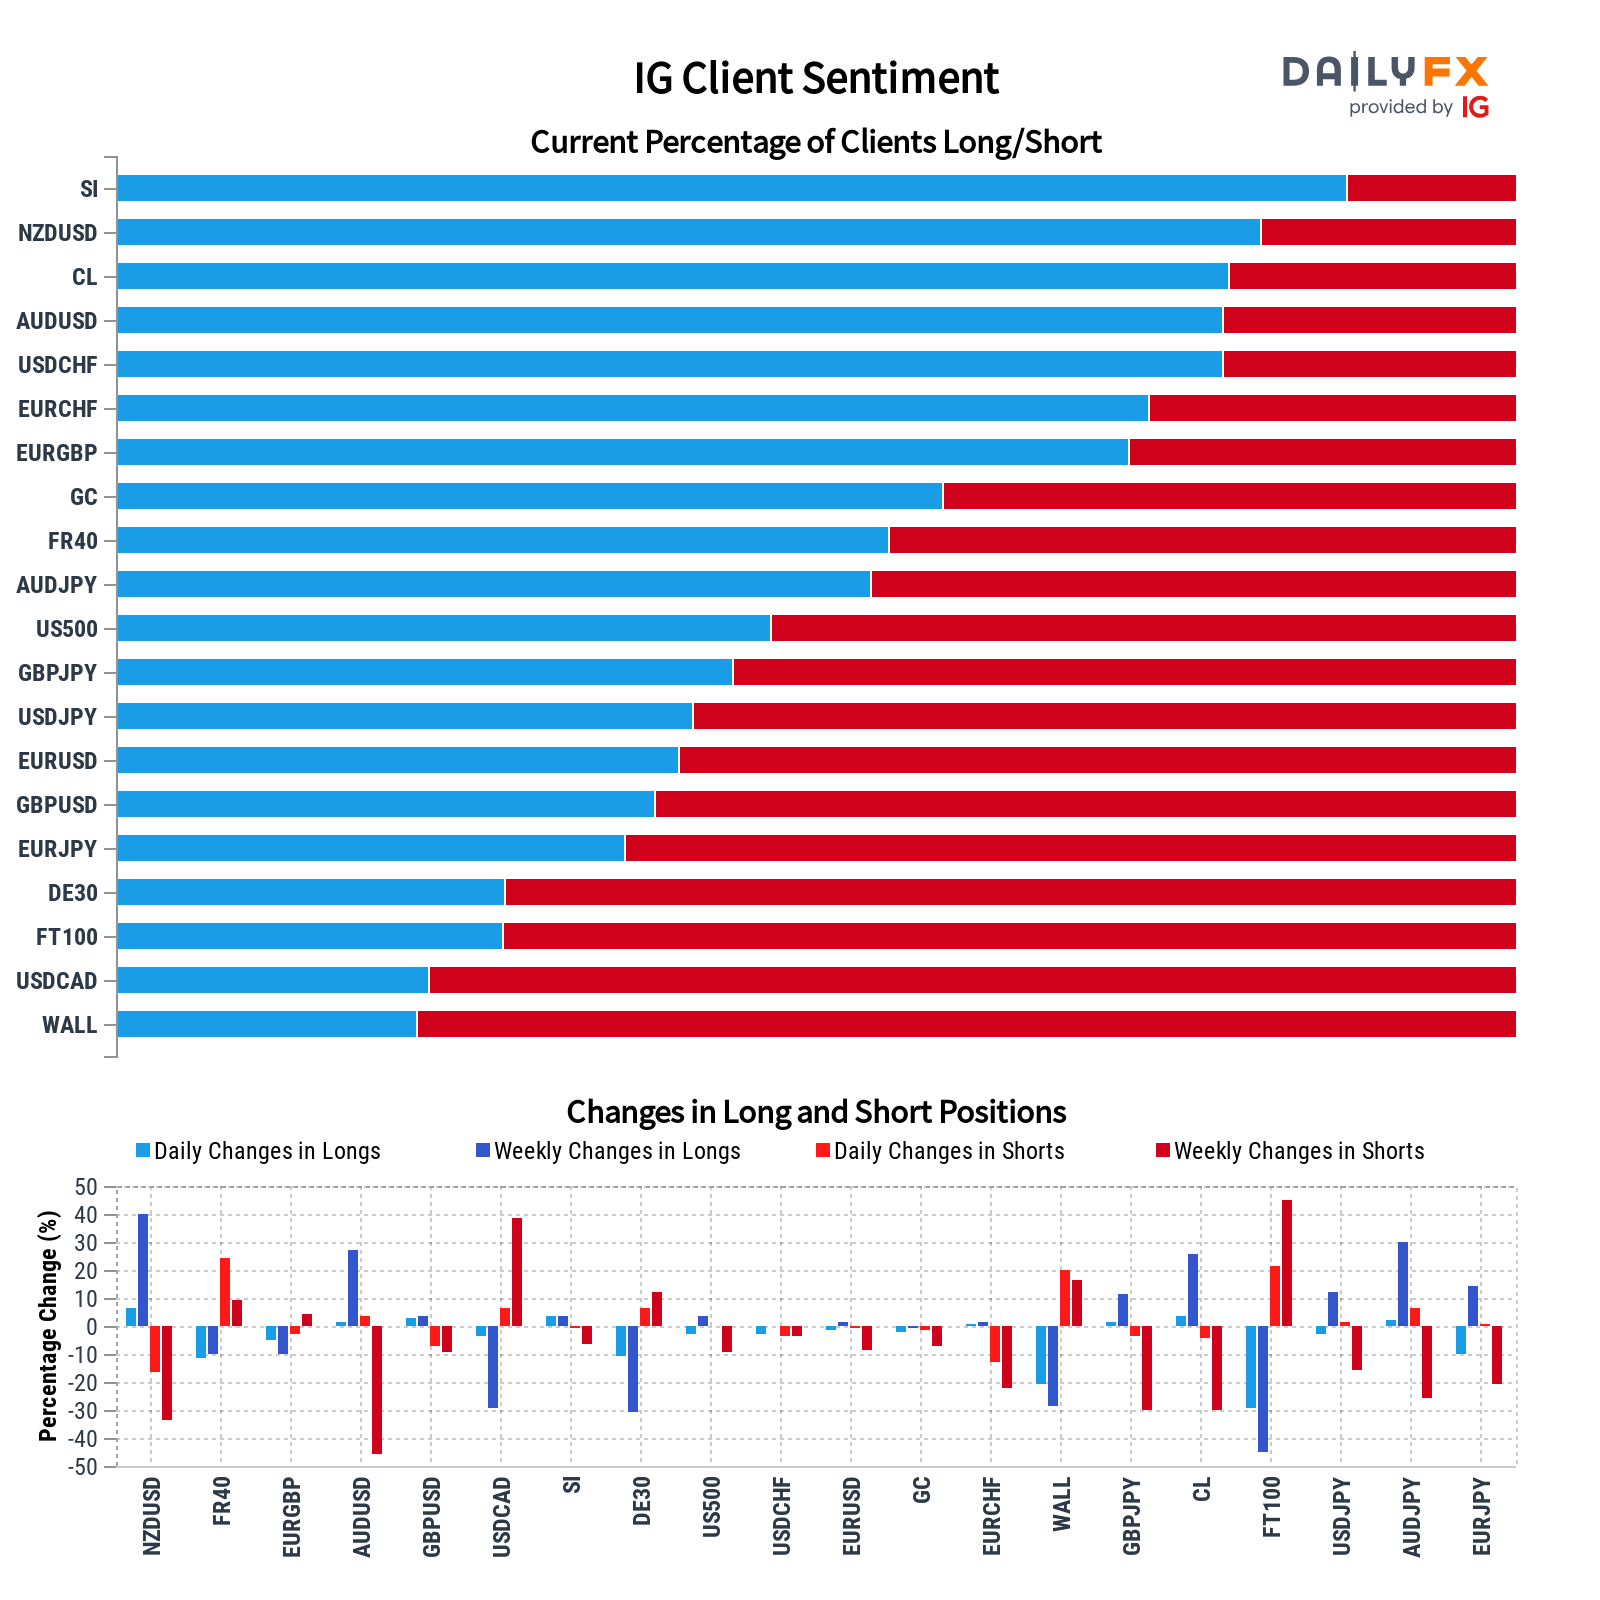
| SYMBOL | TRADING BIAS | NET-LONG% | NET-SHORT% | CHANGE IN LONGS | CHANGE IN SHORTS | CHANGE IN OI |
|---|---|---|---|---|---|---|
| AUD/JPY | MIXED | 53.75% | 46.25% | 0.00% Daily 29.19% Weekly | 11.18% Daily -25.10% Weekly | 4.88% Daily -3.25% Weekly |
| AUD/USD | MIXED | 78.87% | 21.13% | 1.82% Daily 28.97% Weekly | 3.11% Daily -45.86% Weekly | 2.09% Daily -0.18% Weekly |
| Oil - US Crude | BEARISH | 80.16% | 19.84% | 3.48% Daily 31.30% Weekly | -6.83% Daily -38.05% Weekly | 1.26% Daily 7.44% Weekly |
| Germany 40 | BULLISH | 28.91% | 71.09% | -8.67% Daily -26.59% Weekly | 6.62% Daily 8.64% Weekly | 1.70% Daily -4.60% Weekly |
| EUR/CHF | BEARISH | 73.29% | 26.71% | 0.41% Daily 1.65% Weekly | -10.89% Daily -20.35% Weekly | -2.88% Daily -5.34% Weekly |
| EUR/GBP | BULLISH | 72.39% | 27.61% | -4.11% Daily -9.41% Weekly | -2.31% Daily 4.97% Weekly | -3.62% Daily -5.85% Weekly |
| EUR/JPY | MIXED | 36.90% | 63.10% | -8.82% Daily 17.30% Weekly | 0.00% Daily -22.06% Weekly | -3.45% Daily -11.04% Weekly |
| EUR/USD | BEARISH | 40.59% | 59.41% | -1.16% Daily 3.65% Weekly | -3.81% Daily -9.90% Weekly | -2.75% Daily -4.85% Weekly |
| France 40 | BULLISH | 55.92% | 44.08% | -11.83% Daily -8.48% Weekly | 25.55% Daily 3.83% Weekly | 1.49% Daily -3.44% Weekly |
| FTSE 100 | BULLISH | 28.09% | 71.91% | -30.28% Daily -43.75% Weekly | 24.90% Daily 44.36% Weekly | 2.19% Daily 0.26% Weekly |
| GBP/JPY | BEARISH | 44.50% | 55.50% | 1.21% Daily 12.56% Weekly | -3.10% Daily -31.06% Weekly | -1.23% Daily -16.69% Weekly |
| GBP/USD | BEARISH | 38.67% | 61.33% | 3.07% Daily 4.48% Weekly | -6.59% Daily -10.36% Weekly | -3.08% Daily -5.15% Weekly |
| Gold | BEARISH | 59.28% | 40.72% | 0.53% Daily 2.00% Weekly | -3.50% Daily -7.51% Weekly | -1.15% Daily -2.10% Weekly |
| NZD/USD | BEARISH | 81.55% | 18.45% | 6.33% Daily 40.00% Weekly | -12.84% Daily -35.37% Weekly | 2.18% Daily 15.21% Weekly |
| Silver | BEARISH | 87.75% | 12.25% | 3.37% Daily 3.99% Weekly | 1.67% Daily -8.96% Weekly | 3.16% Daily 2.21% Weekly |
| US 500 | BEARISH | 48.96% | 51.04% | 1.18% Daily 15.03% Weekly | -0.75% Daily -12.67% Weekly | 0.18% Daily -0.99% Weekly |
| USD/CAD | BULLISH | 22.55% | 77.45% | -1.88% Daily -30.33% Weekly | 6.85% Daily 37.55% Weekly | 4.75% Daily 12.77% Weekly |
| USD/CHF | MIXED | 78.86% | 21.14% | -0.59% Daily 1.34% Weekly | 1.11% Daily -2.15% Weekly | -0.23% Daily 0.58% Weekly |
| USD/JPY | MIXED | 41.42% | 58.58% | -1.63% Daily 12.46% Weekly | 1.56% Daily -16.45% Weekly | 0.21% Daily -6.50% Weekly |
| Wall Street | BULLISH | 22.41% | 77.59% | -17.70% Daily -19.41% Weekly | 17.78% Daily 14.18% Weekly | 7.40% Daily 4.43% Weekly |
AUD/JPY
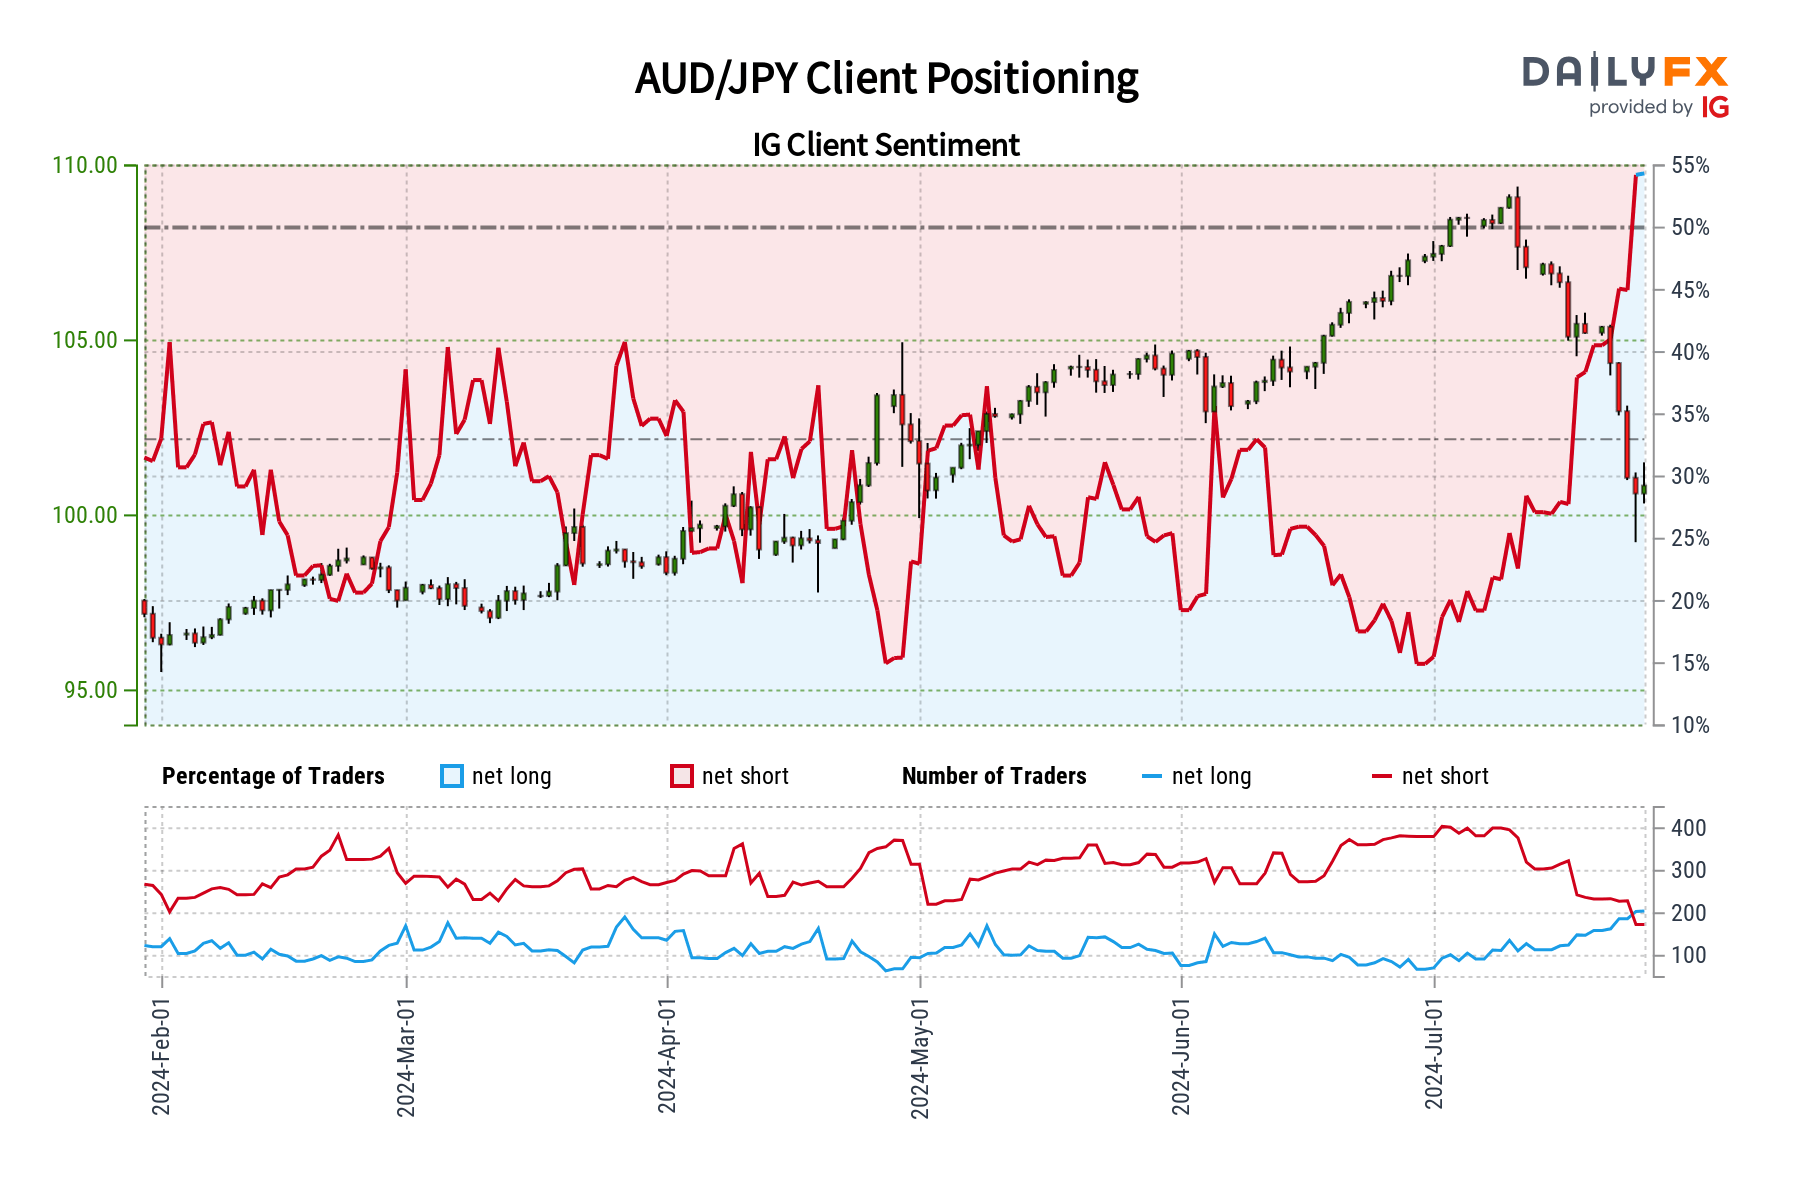
AUD/JPY: Retail trader data shows 53.75% of traders are net-long with the ratio of traders long to short at 1.16 to 1. The number of traders net-long is unchanged than yesterday and 29.19% higher from last week, while the number of traders net-short is 11.18% higher than yesterday and 25.10% lower from last week.
We typically take a contrarian view to crowd sentiment, and the fact traders are net-long suggests AUD/JPY prices may continue to fall.
Positioning is less net-long than yesterday but more net-long from last week. The combination of current sentiment and recent changes gives us a further mixed AUD/JPY trading bias.
AUD/USD
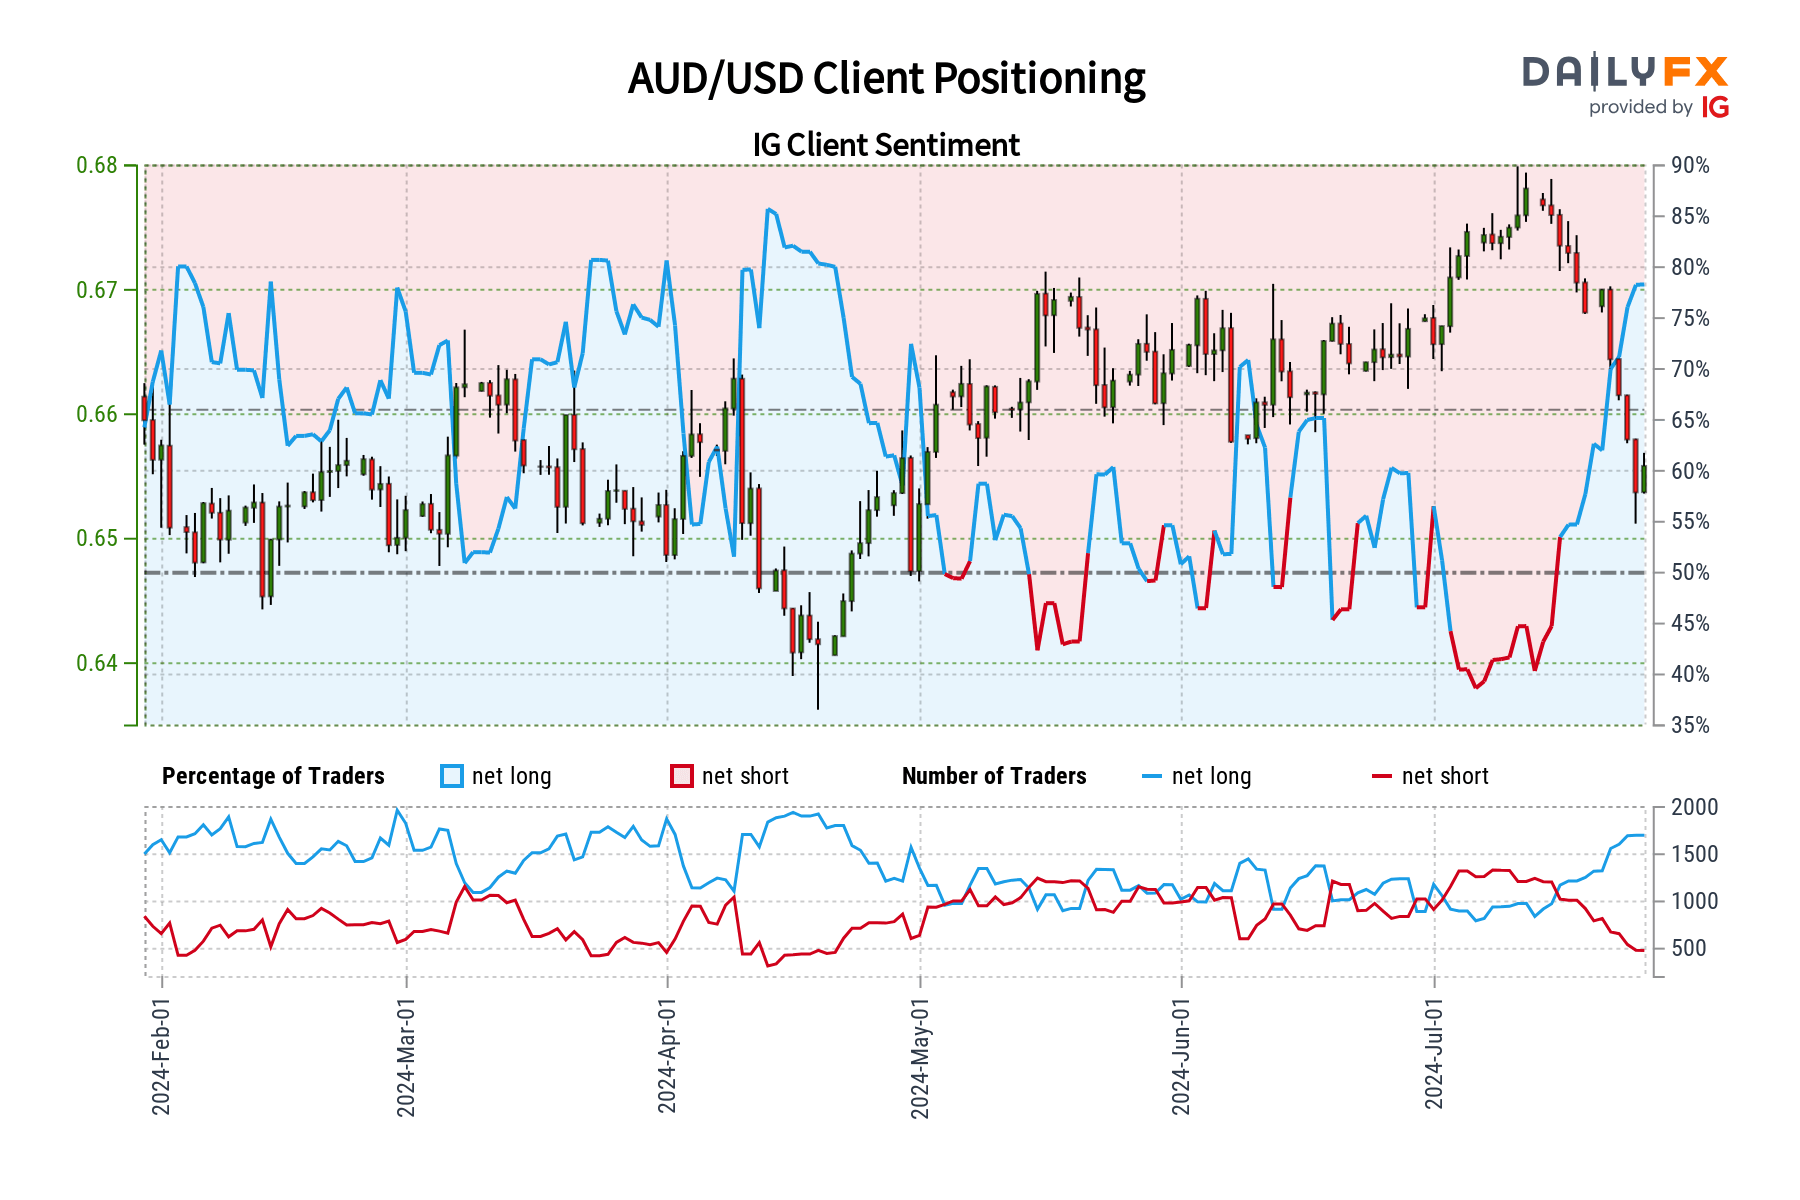
AUD/USD: Retail trader data shows 78.87% of traders are net-long with the ratio of traders long to short at 3.73 to 1. The number of traders net-long is 1.82% higher than yesterday and 28.97% higher from last week, while the number of traders net-short is 3.11% higher than yesterday and 45.86% lower from last week.
We typically take a contrarian view to crowd sentiment, and the fact traders are net-long suggests AUD/USD prices may continue to fall.
Positioning is less net-long than yesterday but more net-long from last week. The combination of current sentiment and recent changes gives us a further mixed AUD/USD trading bias.
Oil - US Crude
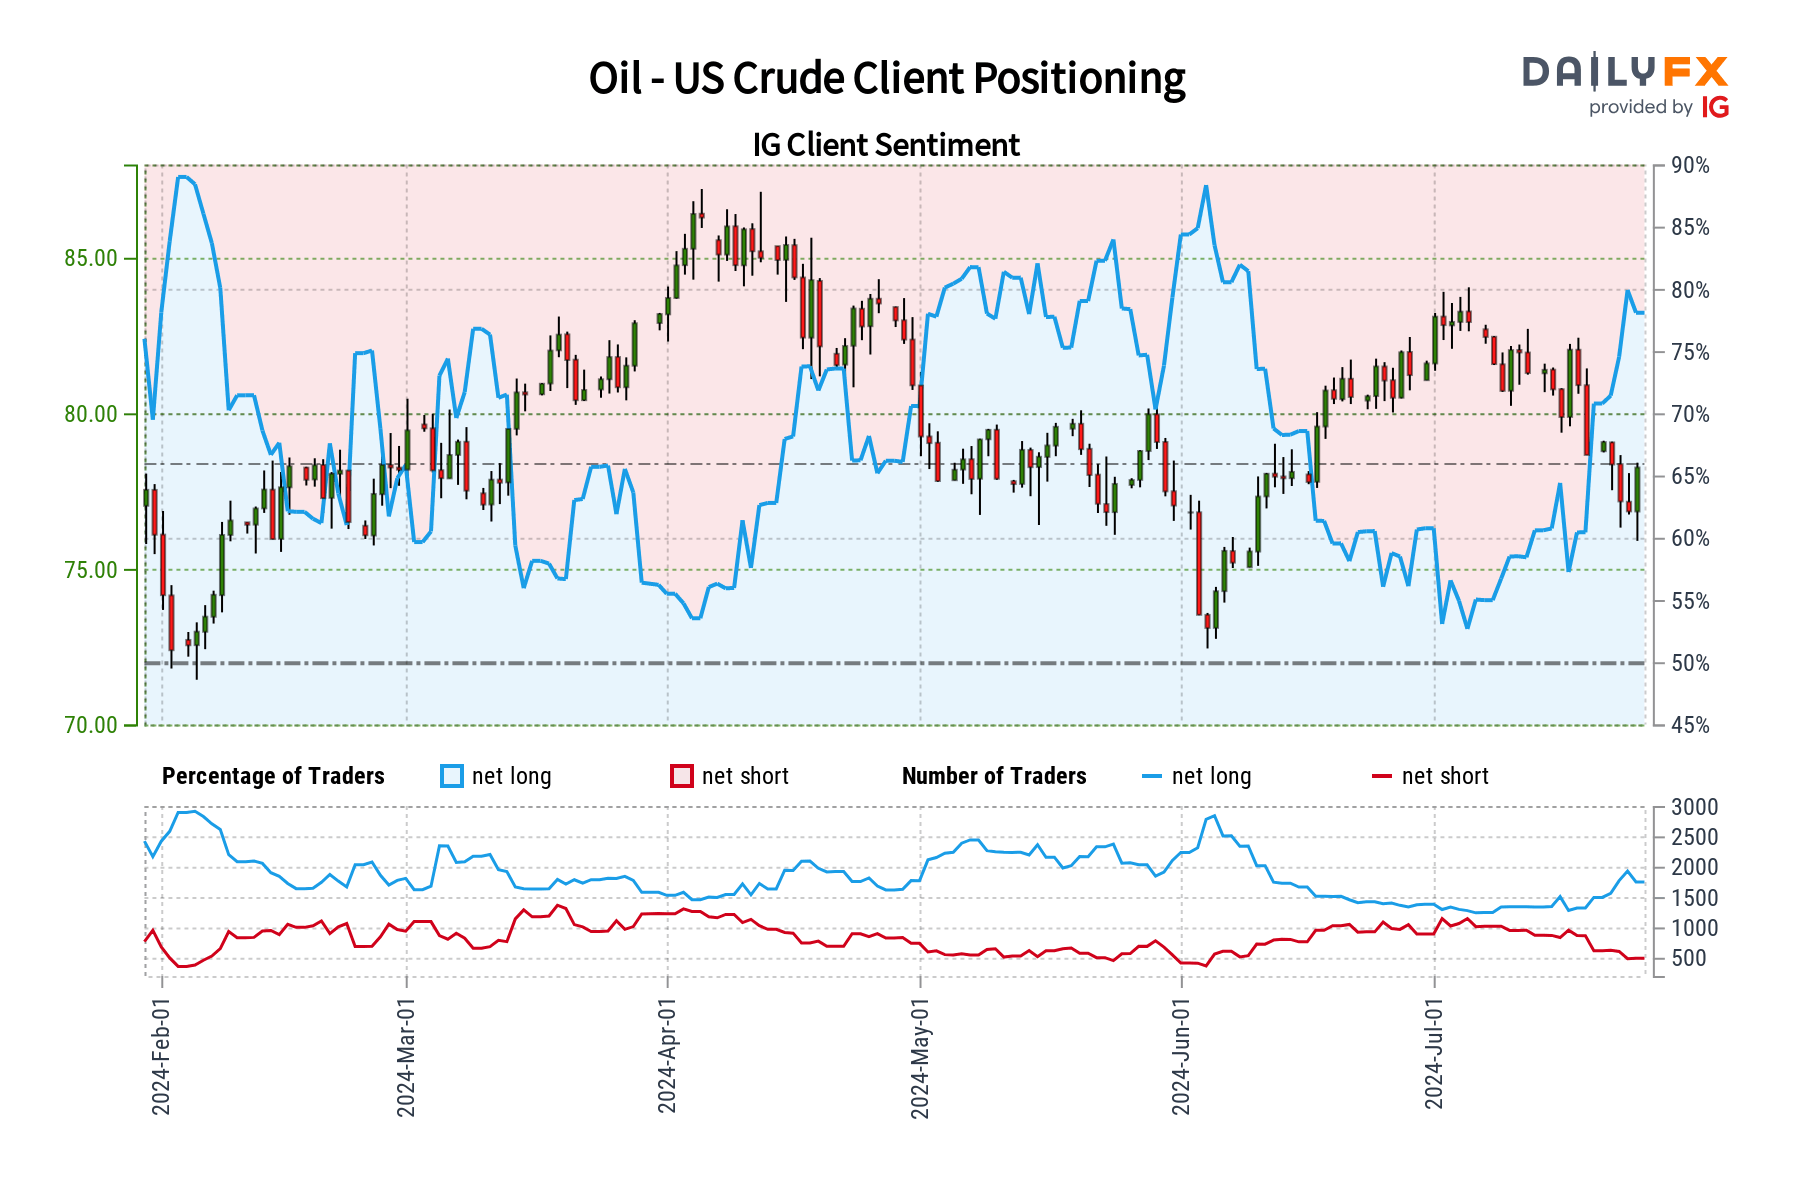
Oil - US Crude: Retail trader data shows 80.16% of traders are net-long with the ratio of traders long to short at 4.04 to 1. The number of traders net-long is 3.48% higher than yesterday and 31.30% higher from last week, while the number of traders net-short is 6.83% lower than yesterday and 38.05% lower from last week.
We typically take a contrarian view to crowd sentiment, and the fact traders are net-long suggests Oil - US Crude prices may continue to fall.
Traders are further net-long than yesterday and last week, and the combination of current sentiment and recent changes gives us a stronger Oil - US Crude-bearish contrarian trading bias.
Germany 40
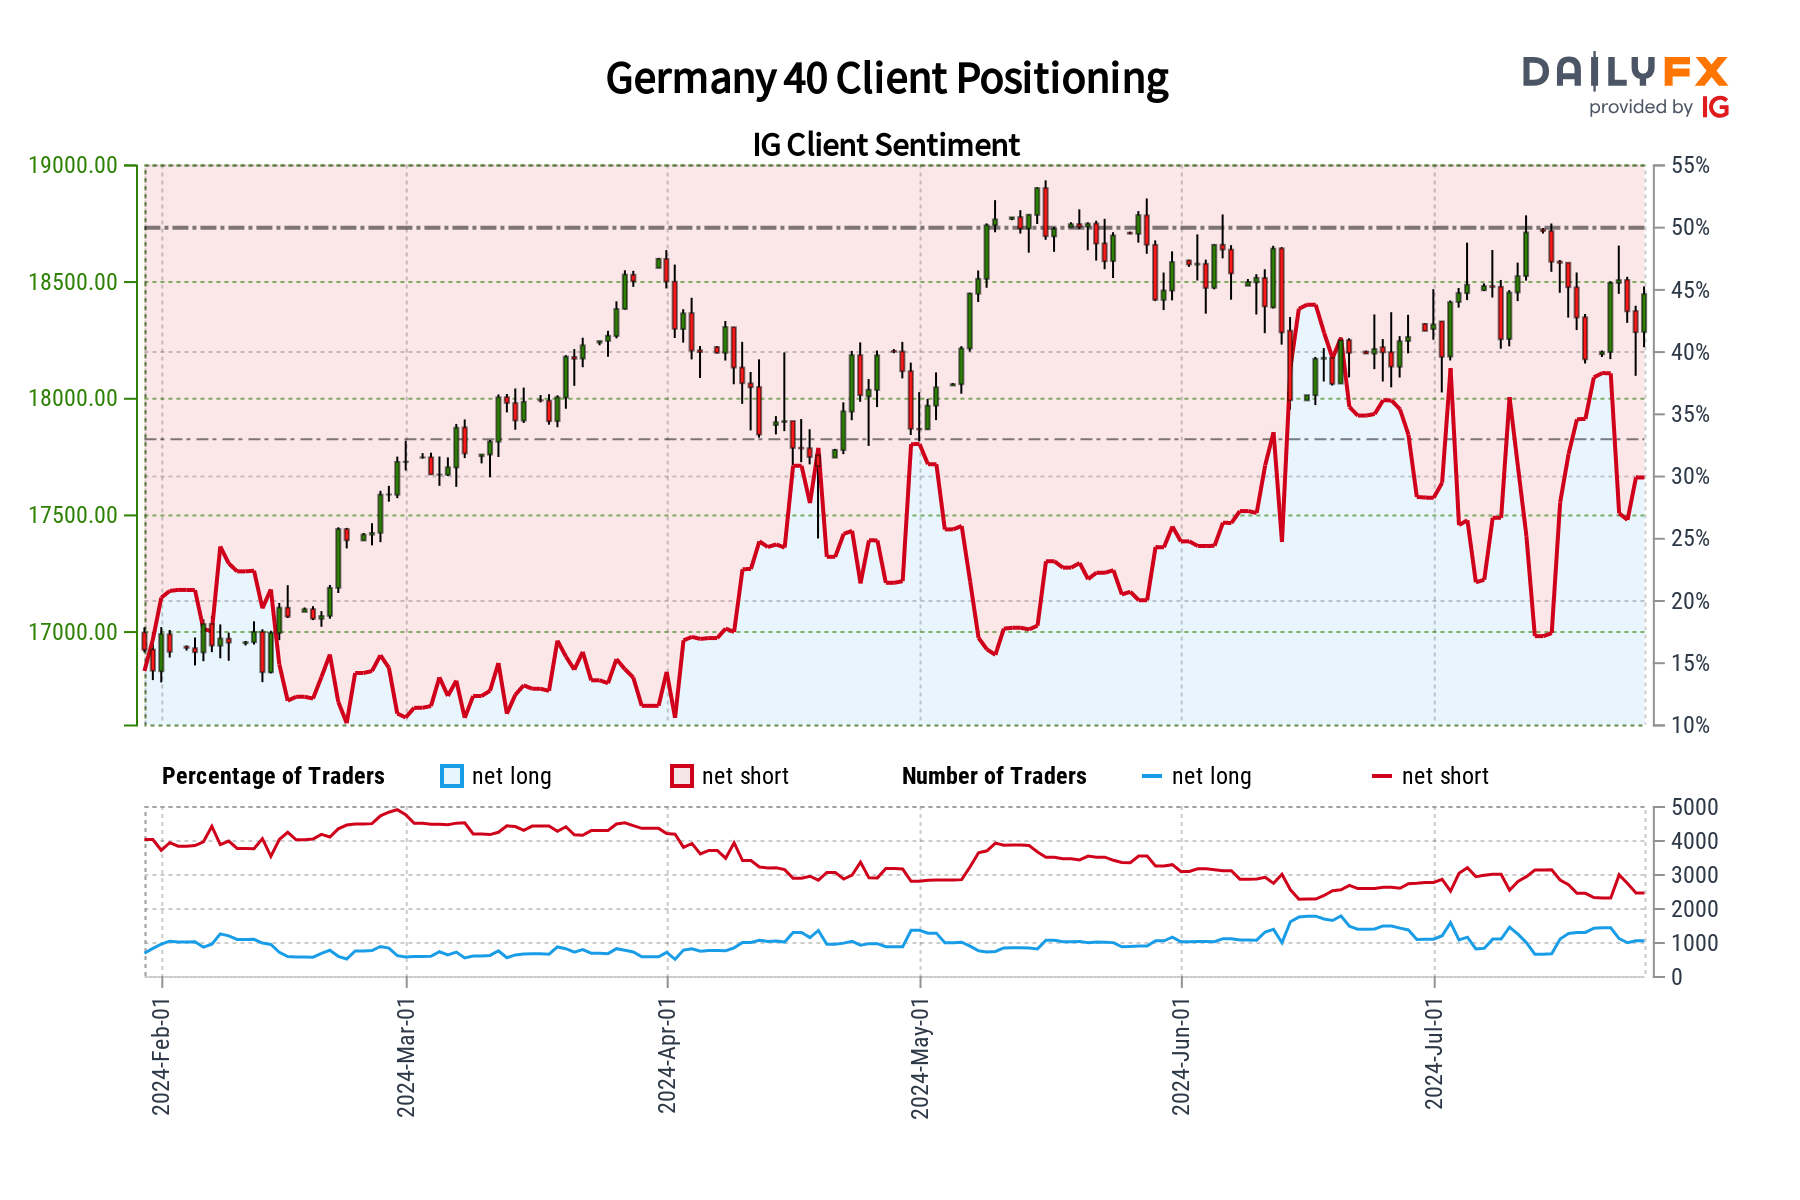
Germany 40: Retail trader data shows 28.91% of traders are net-long with the ratio of traders short to long at 2.46 to 1. The number of traders net-long is 8.67% lower than yesterday and 26.59% lower from last week, while the number of traders net-short is 6.62% higher than yesterday and 8.64% higher from last week.
We typically take a contrarian view to crowd sentiment, and the fact traders are net-short suggests Germany 40 prices may continue to rise.
Traders are further net-short than yesterday and last week, and the combination of current sentiment and recent changes gives us a stronger Germany 40-bullish contrarian trading bias.
EUR/CHF
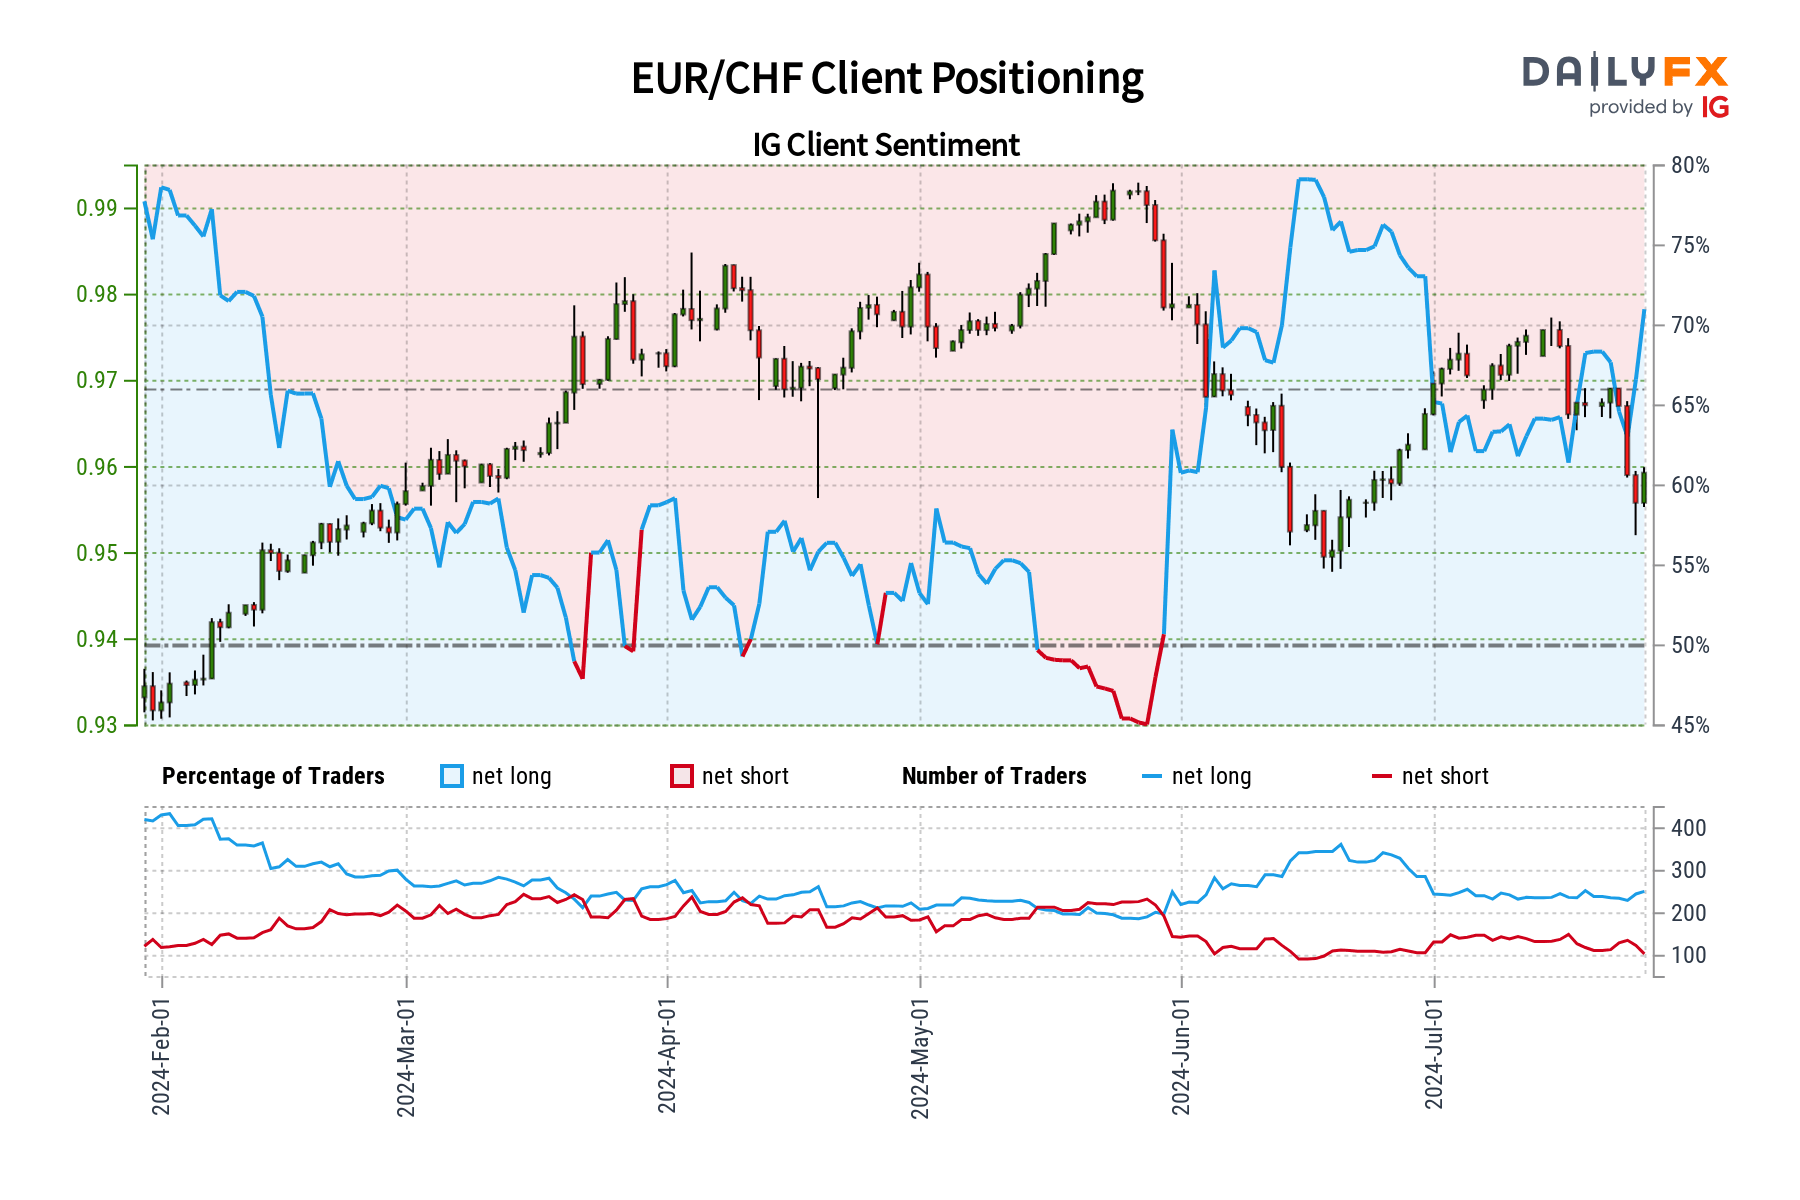
EUR/CHF: Retail trader data shows 73.29% of traders are net-long with the ratio of traders long to short at 2.74 to 1. The number of traders net-long is 0.41% higher than yesterday and 1.65% higher from last week, while the number of traders net-short is 10.89% lower than yesterday and 20.35% lower from last week.
We typically take a contrarian view to crowd sentiment, and the fact traders are net-long suggests EUR/CHF prices may continue to fall.
Traders are further net-long than yesterday and last week, and the combination of current sentiment and recent changes gives us a stronger EUR/CHF-bearish contrarian trading bias.
EUR/GBP
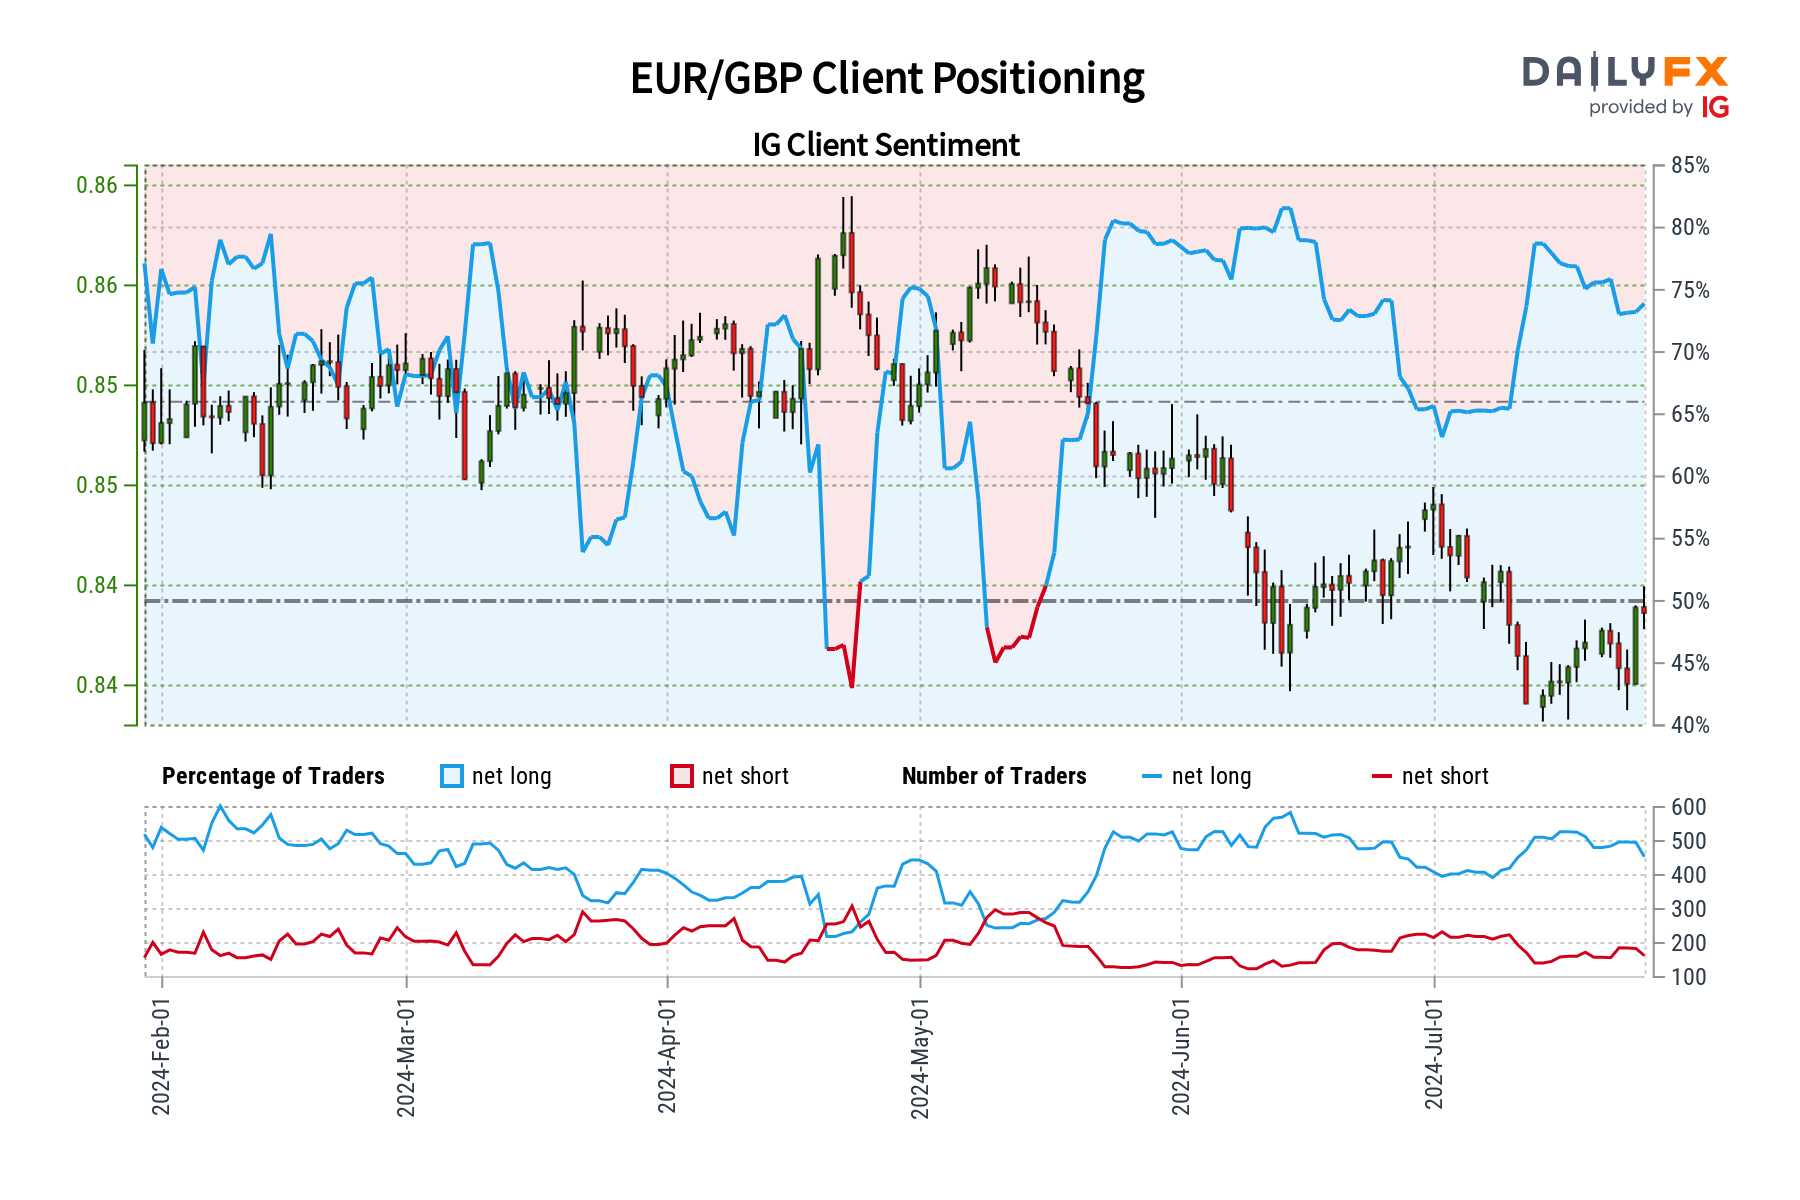
EUR/GBP: Retail trader data shows 72.39% of traders are net-long with the ratio of traders long to short at 2.62 to 1. The number of traders net-long is 4.11% lower than yesterday and 9.41% lower from last week, while the number of traders net-short is 2.31% lower than yesterday and 4.97% higher from last week.
We typically take a contrarian view to crowd sentiment, and the fact traders are net-long suggests EUR/GBP prices may continue to fall.
Yet traders are less net-long than yesterday and compared with last week. Recent changes in sentiment warn that the current EUR/GBP price trend may soon reverse higher despite the fact traders remain net-long.
EUR/JPY
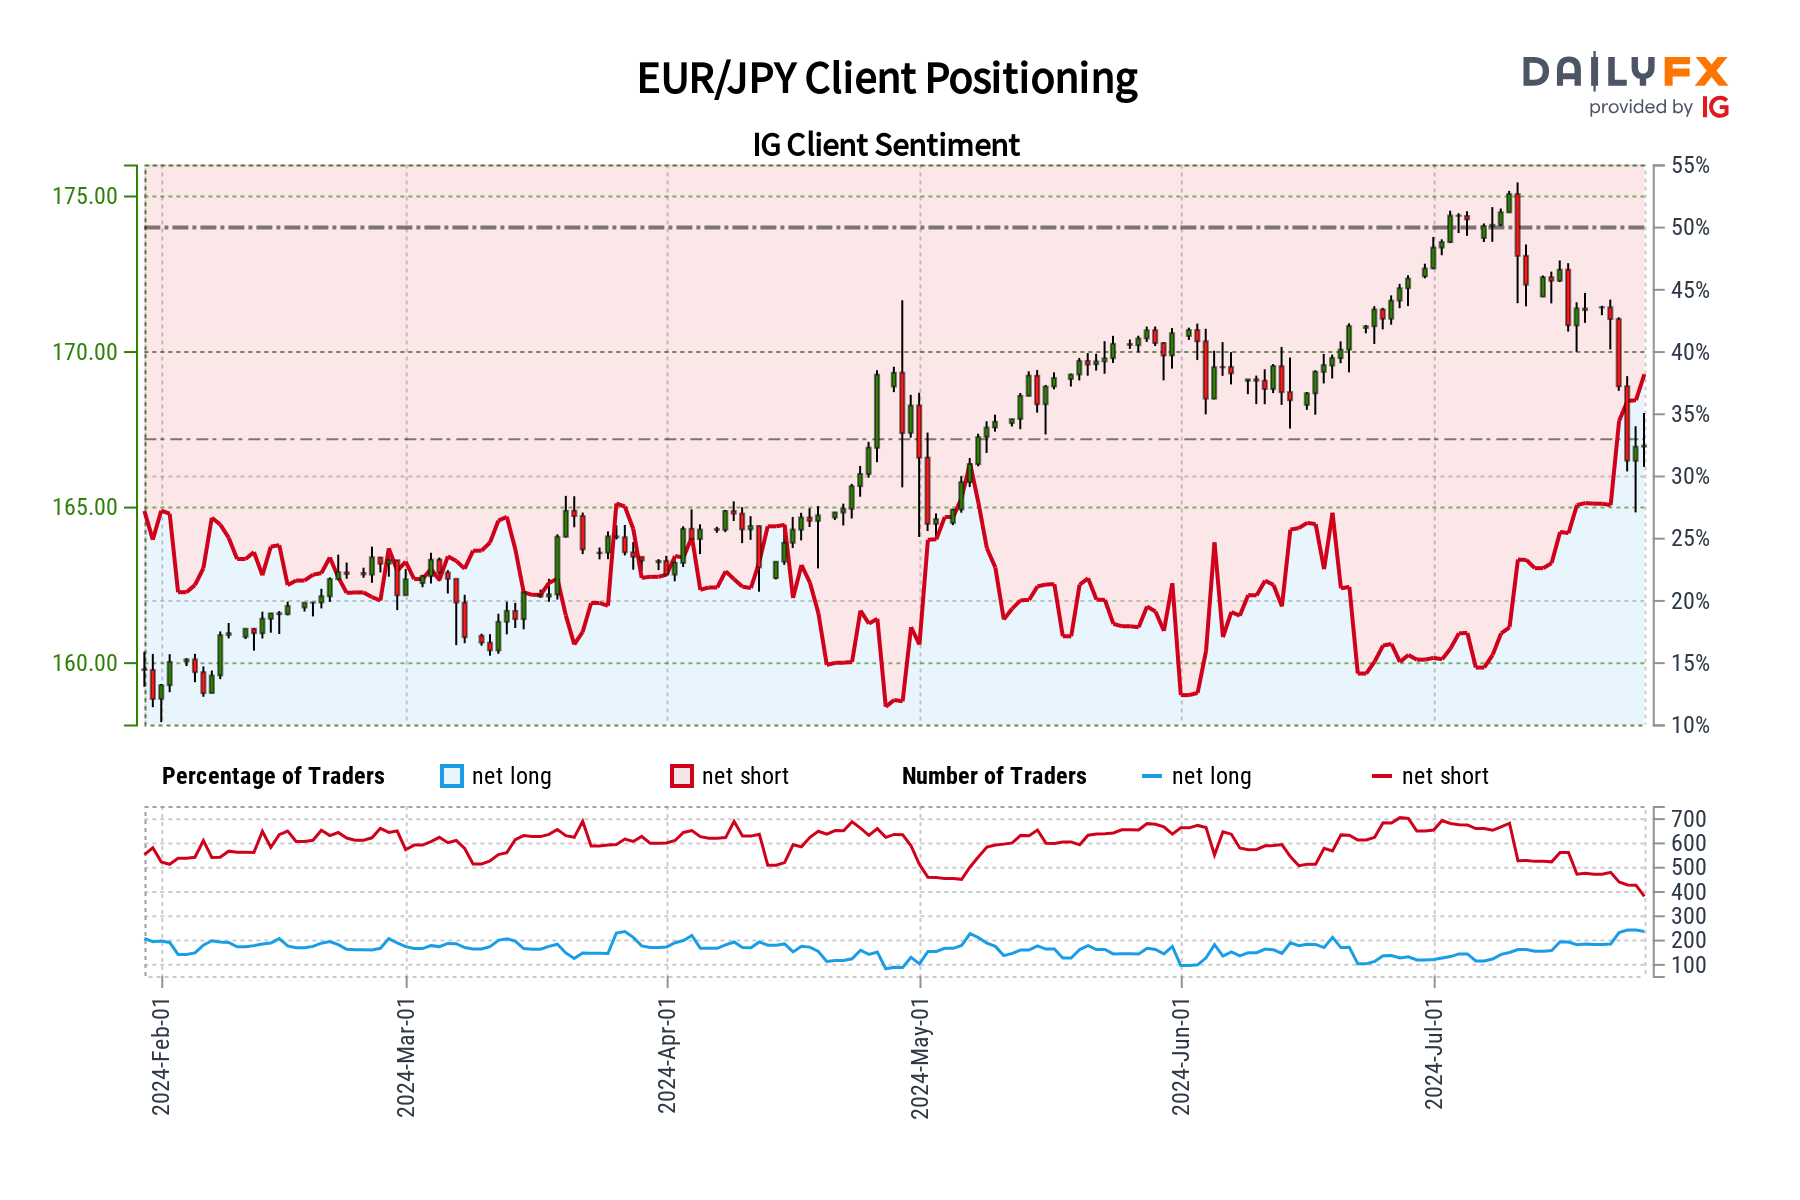
EUR/JPY: Retail trader data shows 36.90% of traders are net-long with the ratio of traders short to long at 1.71 to 1. The number of traders net-long is 8.82% lower than yesterday and 17.30% higher from last week, while the number of traders net-short is unchanged than yesterday and 22.06% lower from last week.
We typically take a contrarian view to crowd sentiment, and the fact traders are net-short suggests EUR/JPY prices may continue to rise.
Positioning is more net-short than yesterday but less net-short from last week. The combination of current sentiment and recent changes gives us a further mixed EUR/JPY trading bias.
EUR/USD
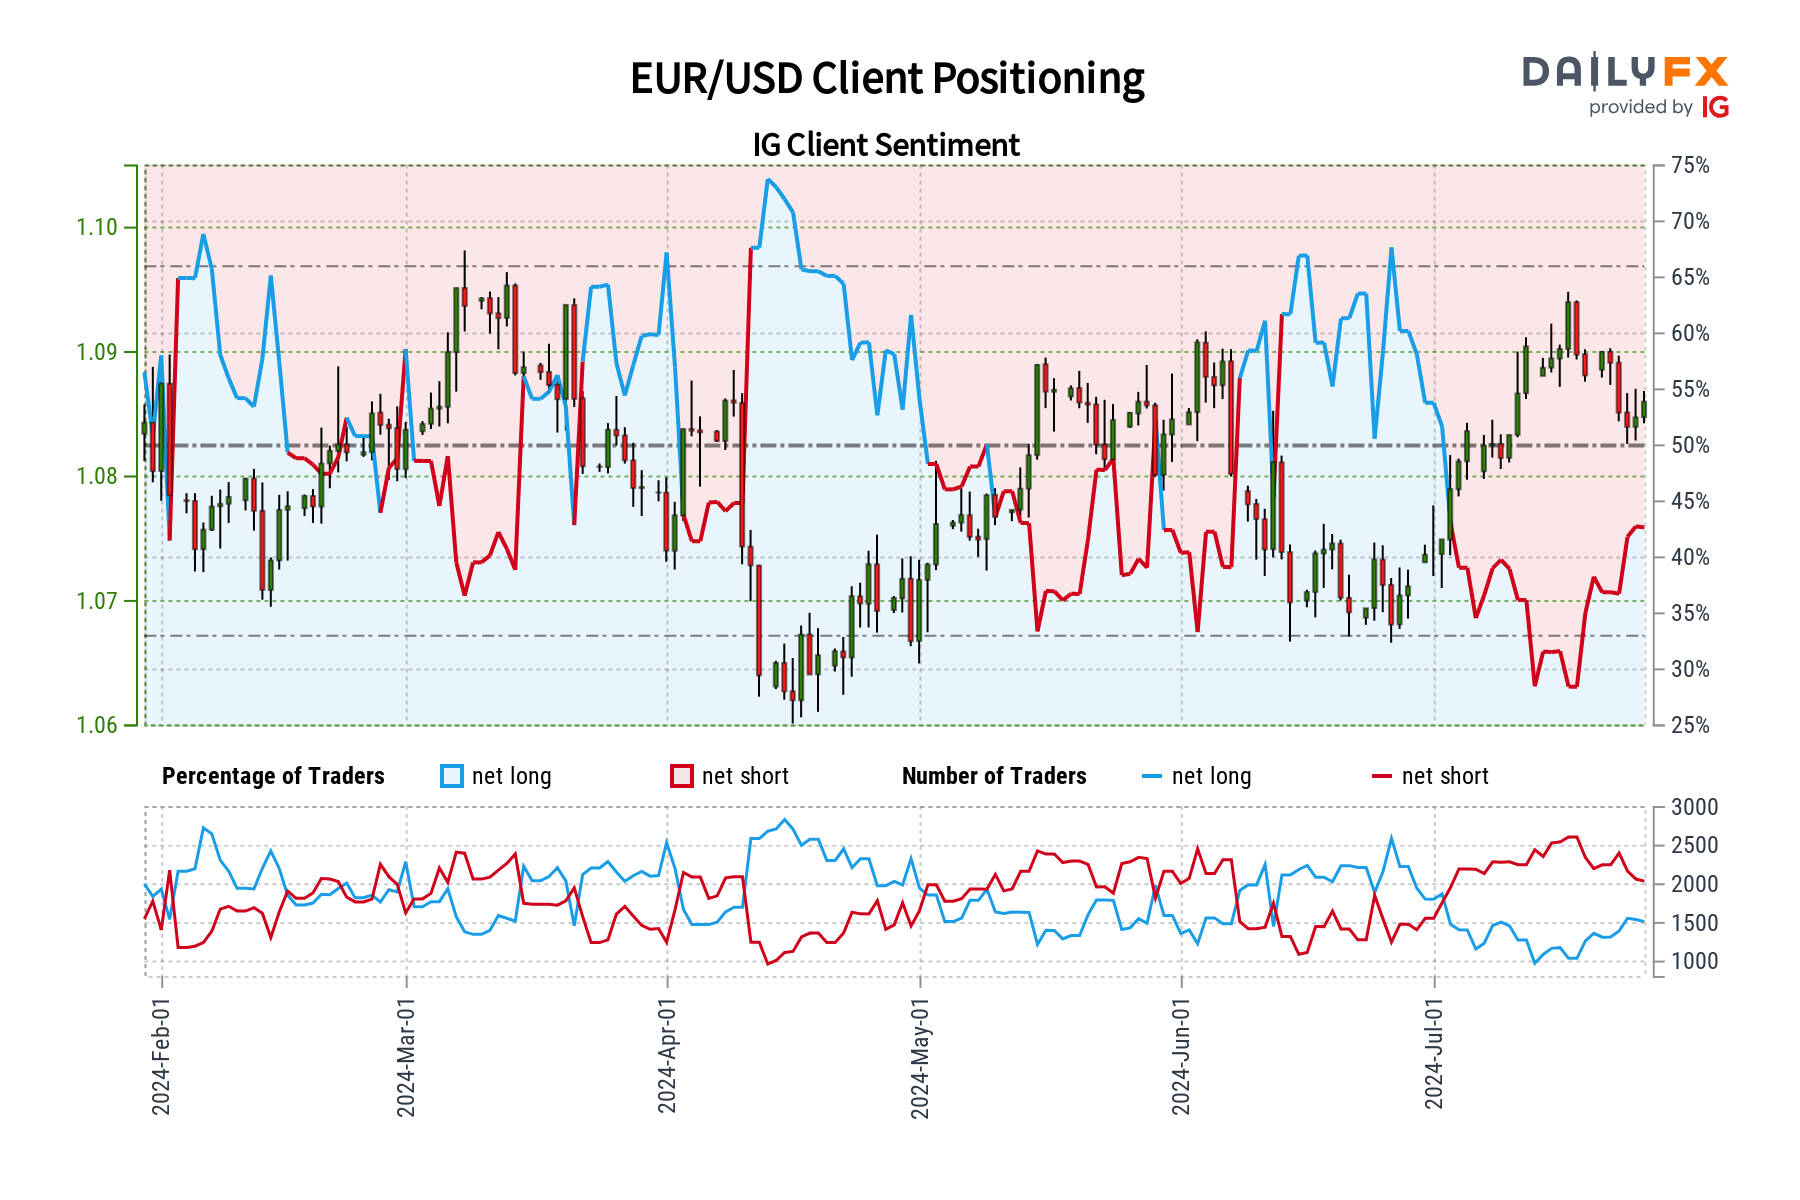
EUR/USD: Retail trader data shows 40.59% of traders are net-long with the ratio of traders short to long at 1.46 to 1. The number of traders net-long is 1.16% lower than yesterday and 3.65% higher from last week, while the number of traders net-short is 3.81% lower than yesterday and 9.90% lower from last week.
We typically take a contrarian view to crowd sentiment, and the fact traders are net-short suggests EUR/USD prices may continue to rise.
Yet traders are less net-short than yesterday and compared with last week. Recent changes in sentiment warn that the current EUR/USD price trend may soon reverse lower despite the fact traders remain net-short.
France 40
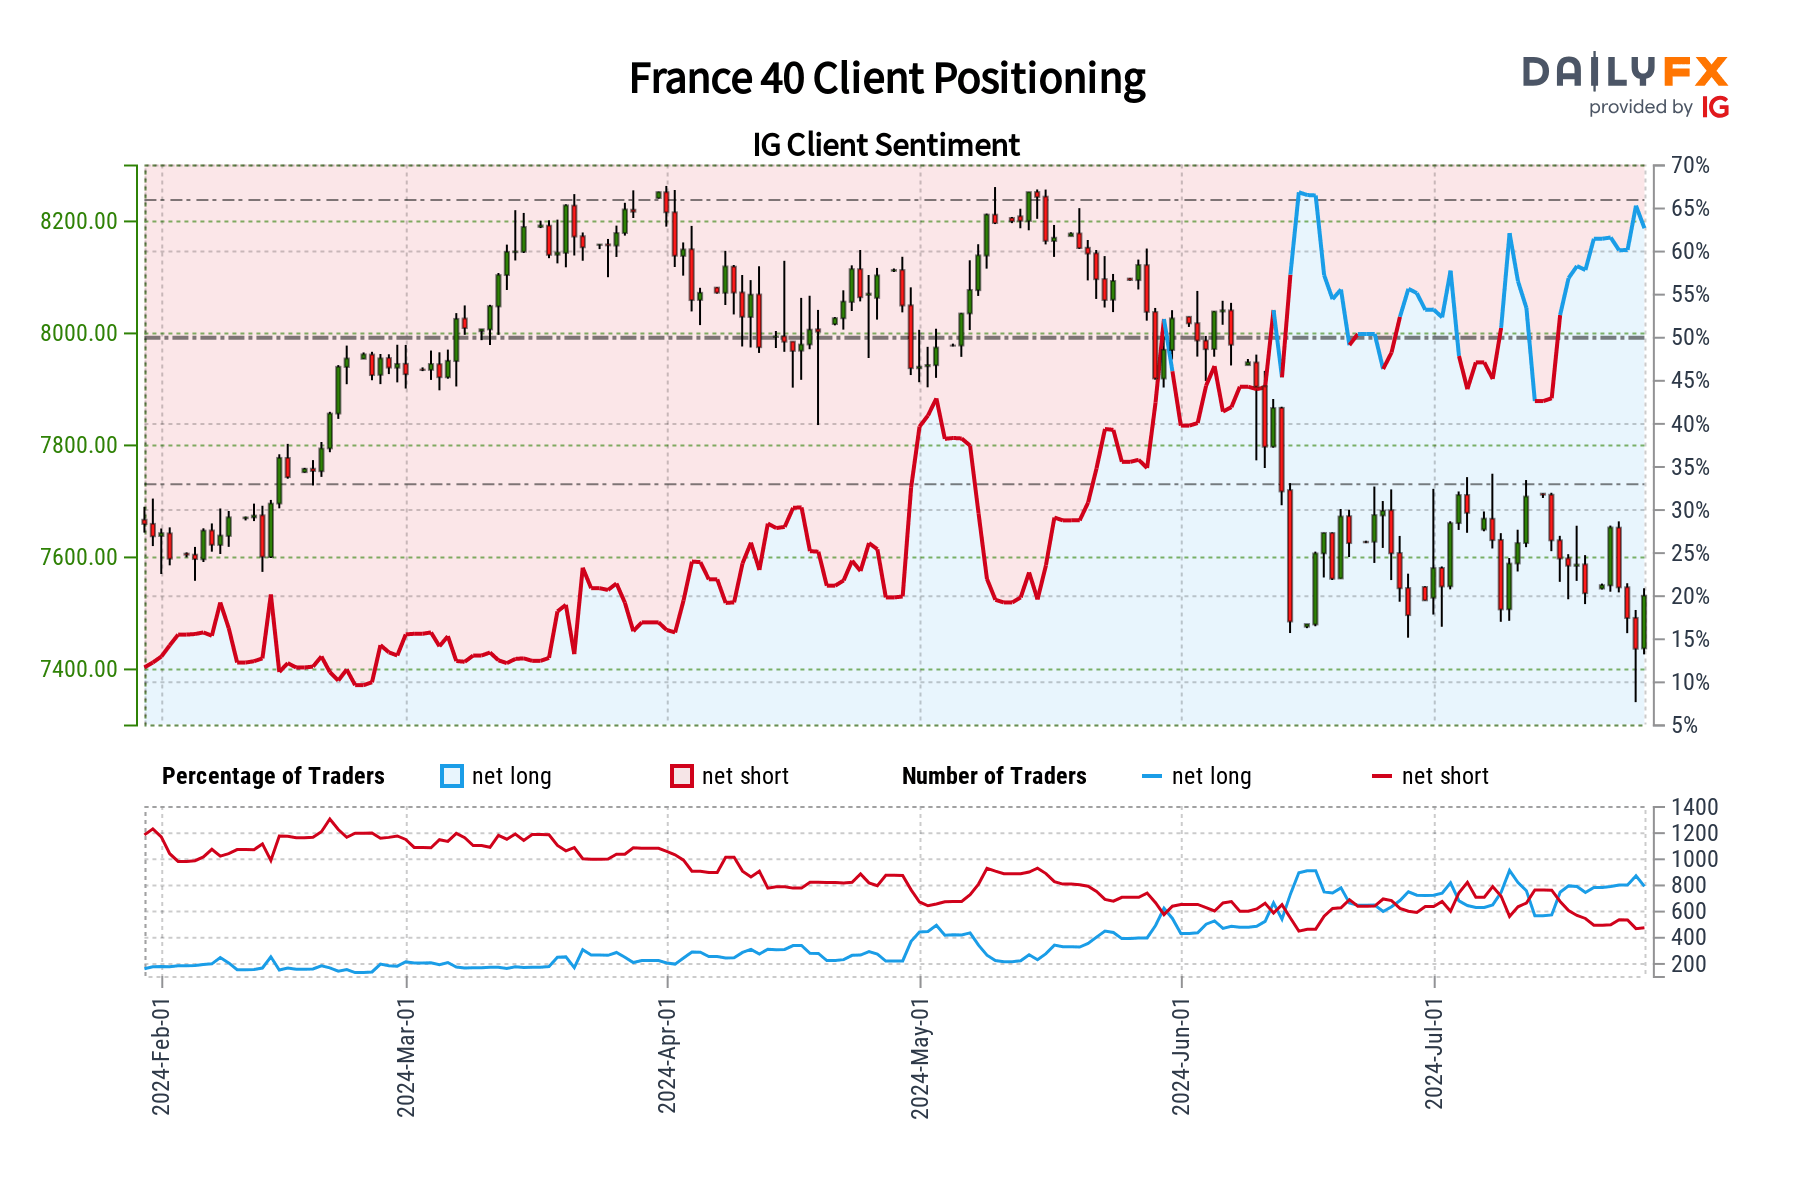
France 40: Retail trader data shows 55.92% of traders are net-long with the ratio of traders long to short at 1.27 to 1. The number of traders net-long is 11.83% lower than yesterday and 8.48% lower from last week, while the number of traders net-short is 25.55% higher than yesterday and 3.83% higher from last week.
We typically take a contrarian view to crowd sentiment, and the fact traders are net-long suggests France 40 prices may continue to fall.
Yet traders are less net-long than yesterday and compared with last week. Recent changes in sentiment warn that the current France 40 price trend may soon reverse higher despite the fact traders remain net-long.
FTSE 100
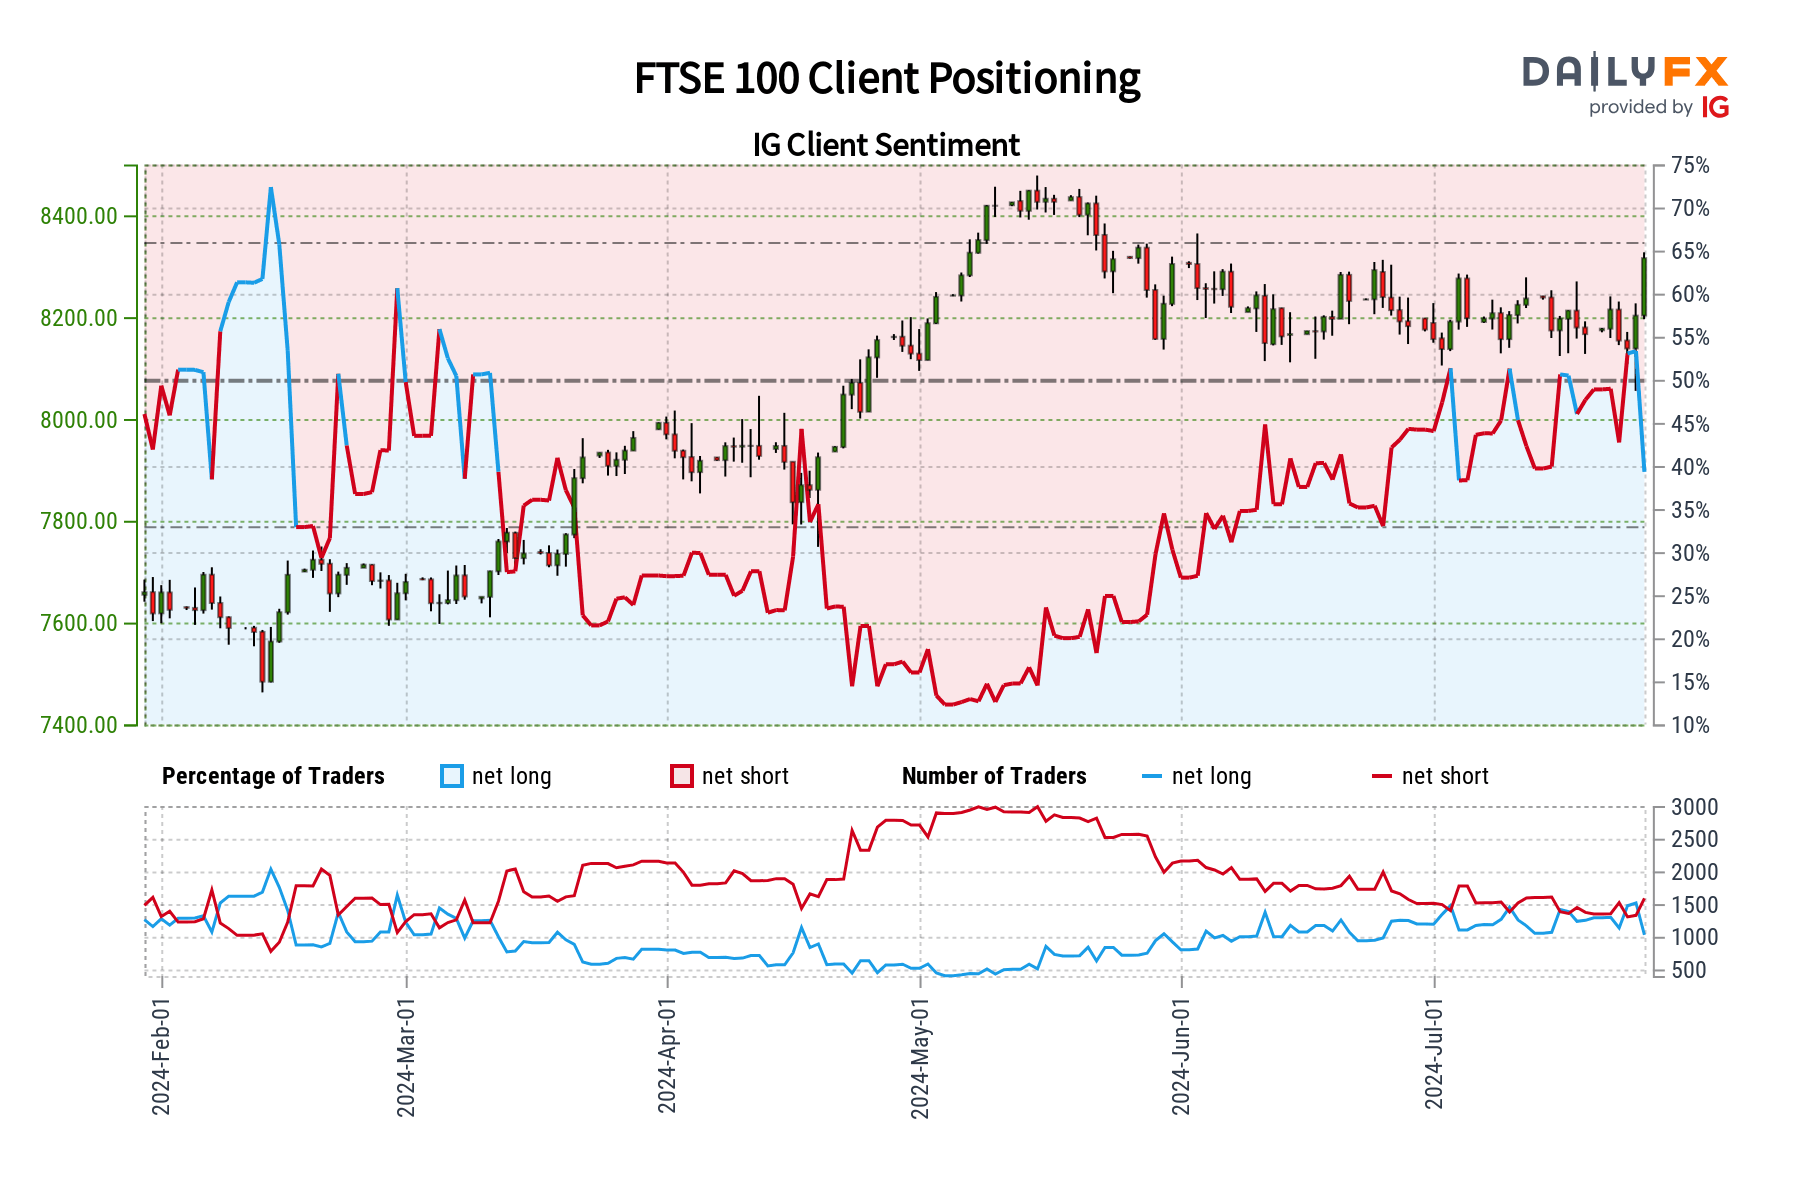
FTSE 100: Retail trader data shows 28.09% of traders are net-long with the ratio of traders short to long at 2.56 to 1. The number of traders net-long is 30.28% lower than yesterday and 43.75% lower from last week, while the number of traders net-short is 24.90% higher than yesterday and 44.36% higher from last week.
We typically take a contrarian view to crowd sentiment, and the fact traders are net-short suggests FTSE 100 prices may continue to rise.
Traders are further net-short than yesterday and last week, and the combination of current sentiment and recent changes gives us a stronger FTSE 100-bullish contrarian trading bias.
GBP/JPY
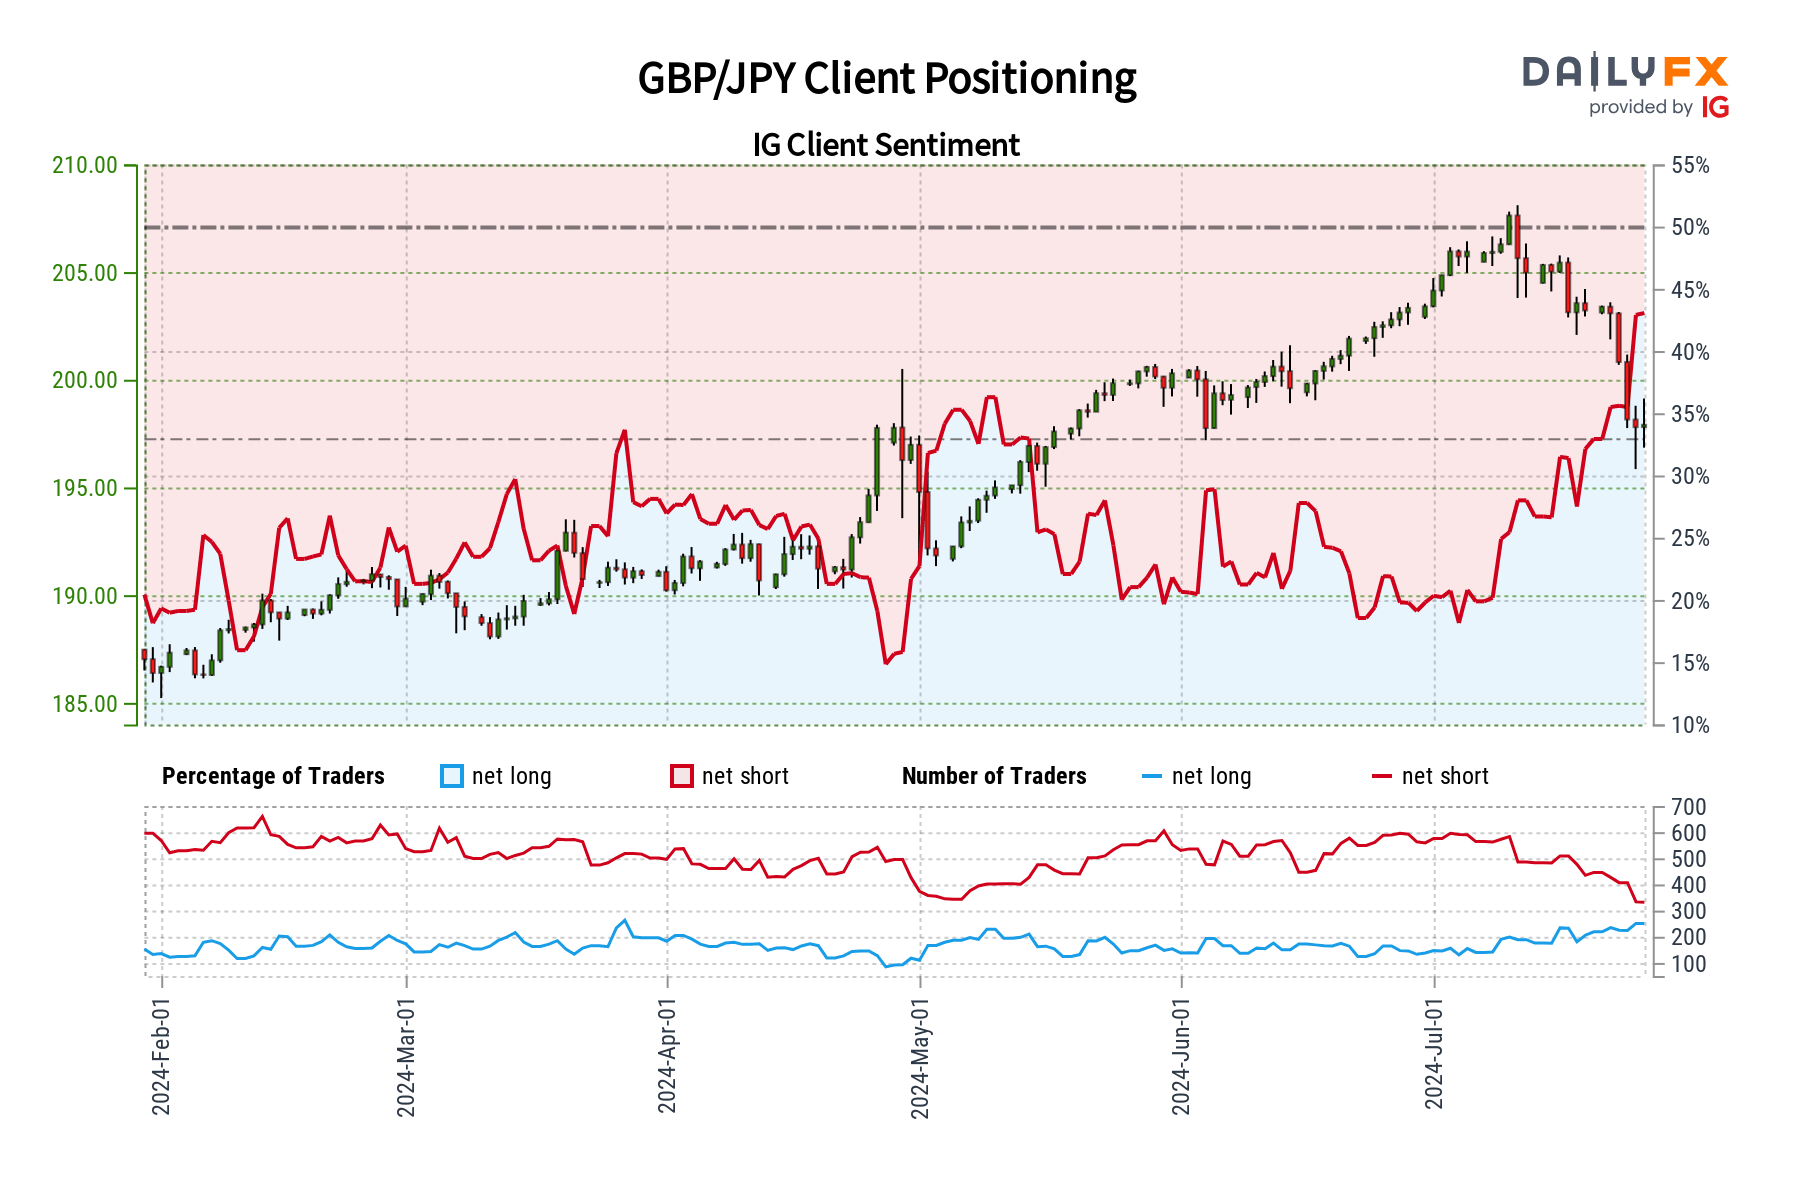
GBP/JPY: Retail trader data shows 44.50% of traders are net-long with the ratio of traders short to long at 1.25 to 1. The number of traders net-long is 1.21% higher than yesterday and 12.56% higher from last week, while the number of traders net-short is 3.10% lower than yesterday and 31.06% lower from last week.
We typically take a contrarian view to crowd sentiment, and the fact traders are net-short suggests GBP/JPY prices may continue to rise.
Yet traders are less net-short than yesterday and compared with last week. Recent changes in sentiment warn that the current GBP/JPY price trend may soon reverse lower despite the fact traders remain net-short.
GBP/USD
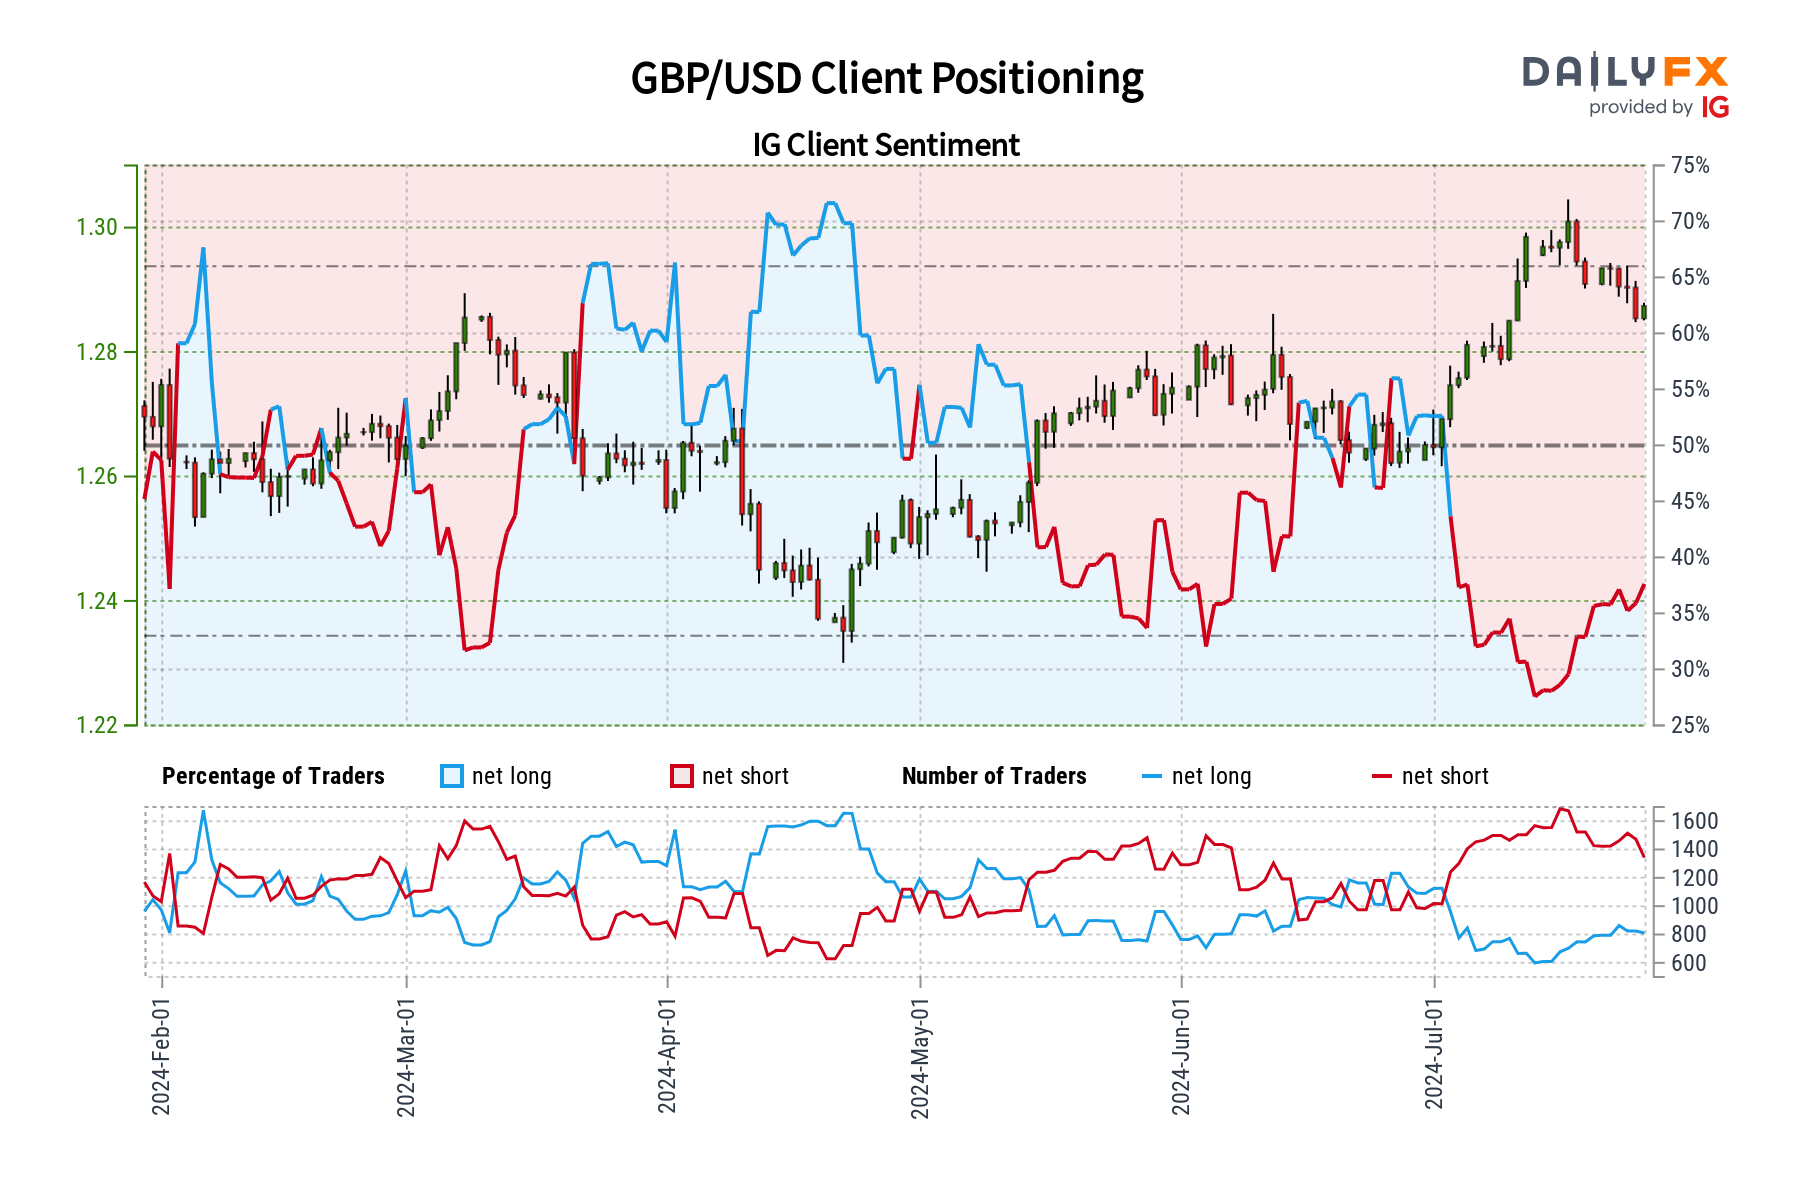
GBP/USD: Retail trader data shows 38.67% of traders are net-long with the ratio of traders short to long at 1.59 to 1. The number of traders net-long is 3.07% higher than yesterday and 4.48% higher from last week, while the number of traders net-short is 6.59% lower than yesterday and 10.36% lower from last week.
We typically take a contrarian view to crowd sentiment, and the fact traders are net-short suggests GBP/USD prices may continue to rise.
Yet traders are less net-short than yesterday and compared with last week. Recent changes in sentiment warn that the current GBP/USD price trend may soon reverse lower despite the fact traders remain net-short.
Gold
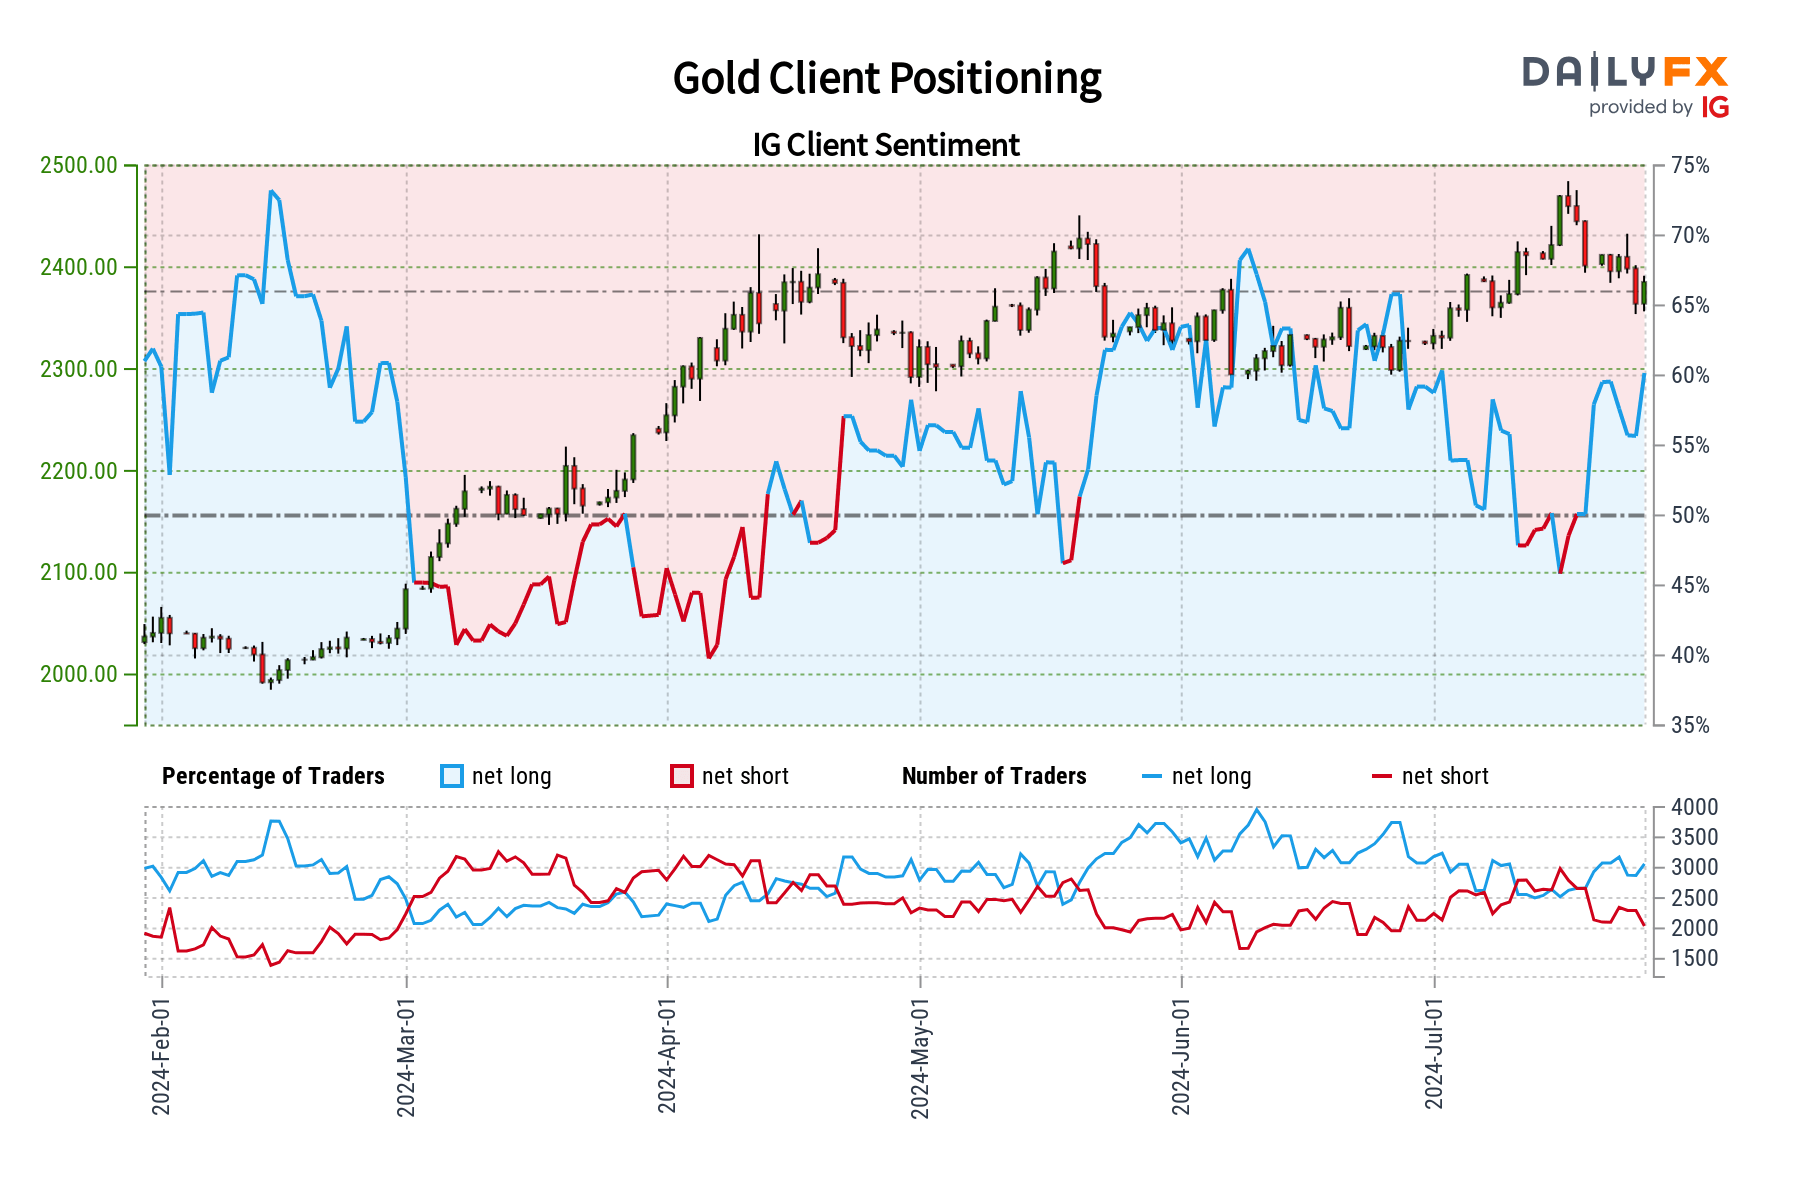
Gold: Retail trader data shows 59.28% of traders are net-long with the ratio of traders long to short at 1.46 to 1. The number of traders net-long is 0.53% higher than yesterday and 2.00% higher from last week, while the number of traders net-short is 3.50% lower than yesterday and 7.51% lower from last week.
We typically take a contrarian view to crowd sentiment, and the fact traders are net-long suggests Gold prices may continue to fall.
Traders are further net-long than yesterday and last week, and the combination of current sentiment and recent changes gives us a stronger Gold-bearish contrarian trading bias.
NZD/USD
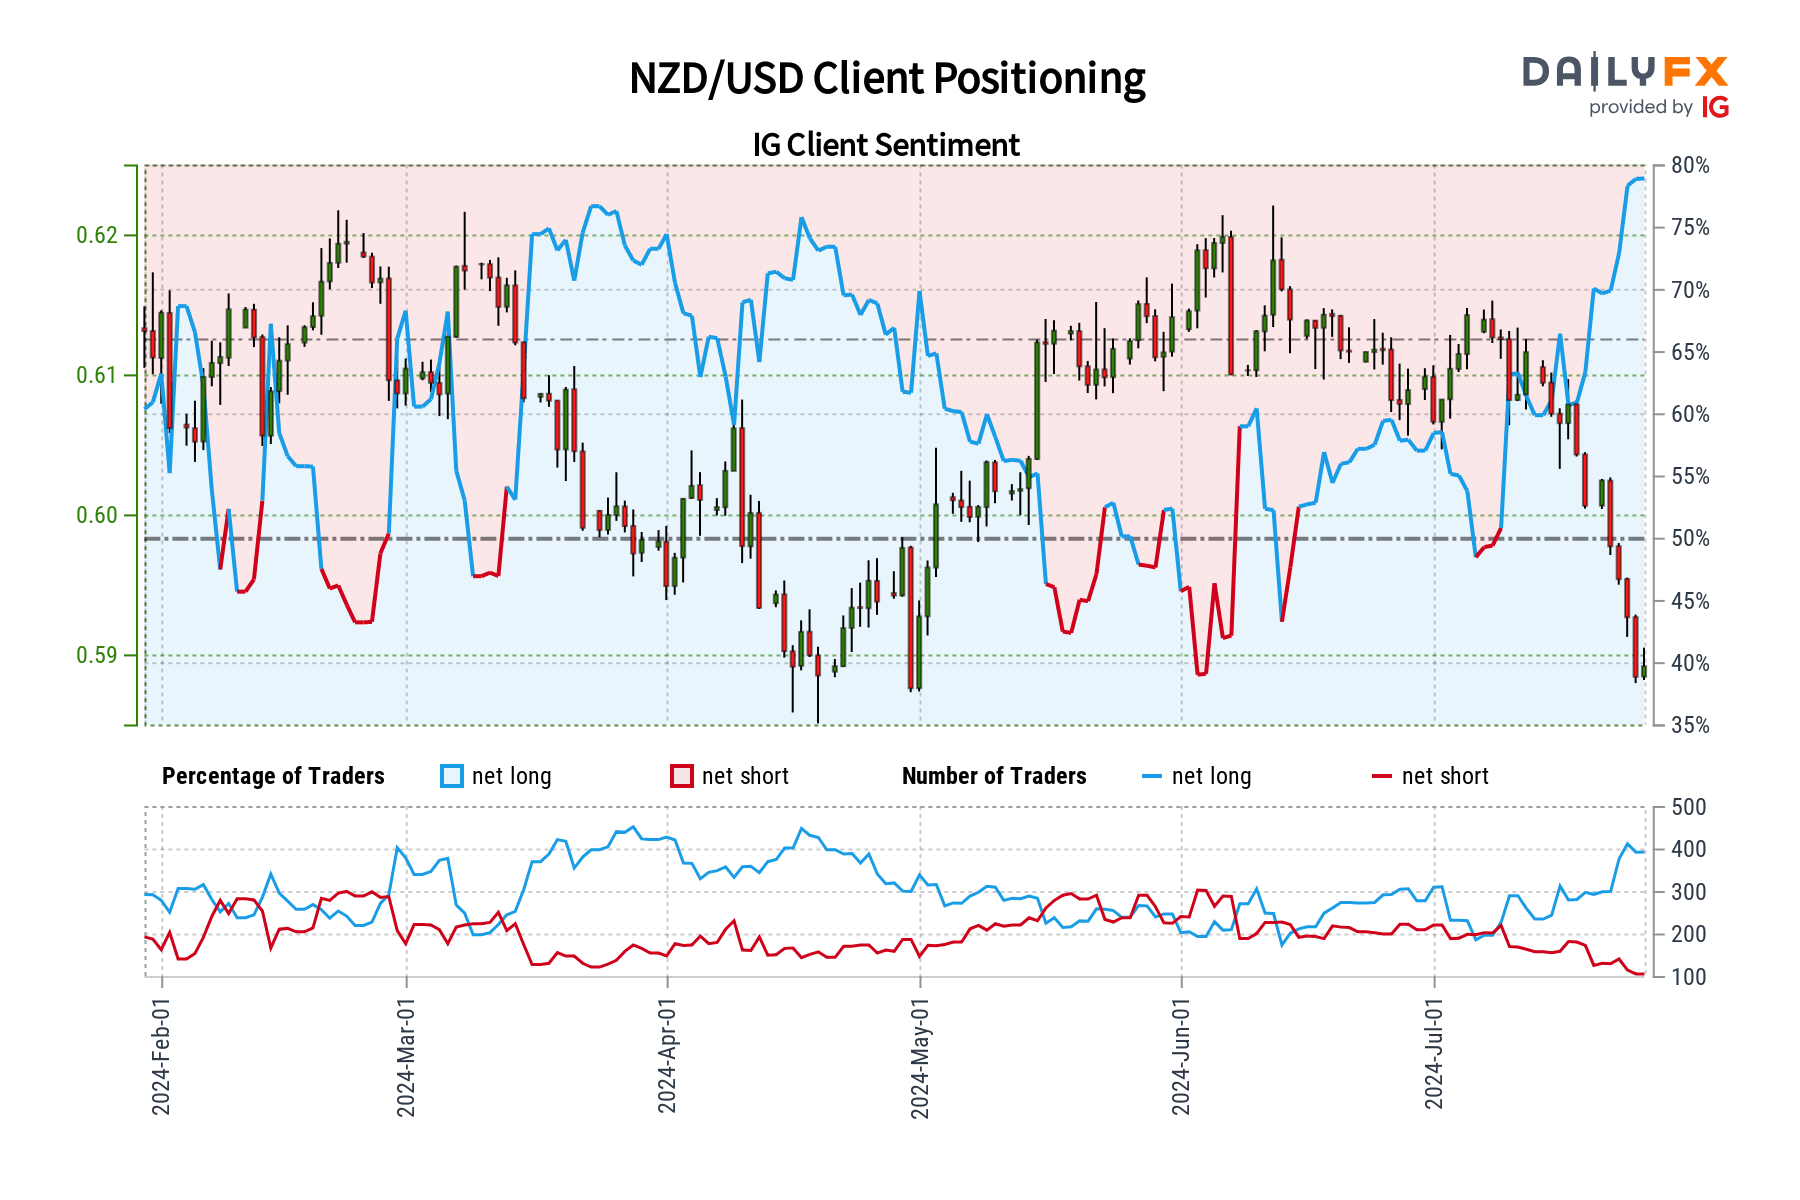
NZD/USD: Retail trader data shows 81.55% of traders are net-long with the ratio of traders long to short at 4.42 to 1. The number of traders net-long is 6.33% higher than yesterday and 40.00% higher from last week, while the number of traders net-short is 12.84% lower than yesterday and 35.37% lower from last week.
We typically take a contrarian view to crowd sentiment, and the fact traders are net-long suggests NZD/USD prices may continue to fall.
Traders are further net-long than yesterday and last week, and the combination of current sentiment and recent changes gives us a stronger NZD/USD-bearish contrarian trading bias.
Silver
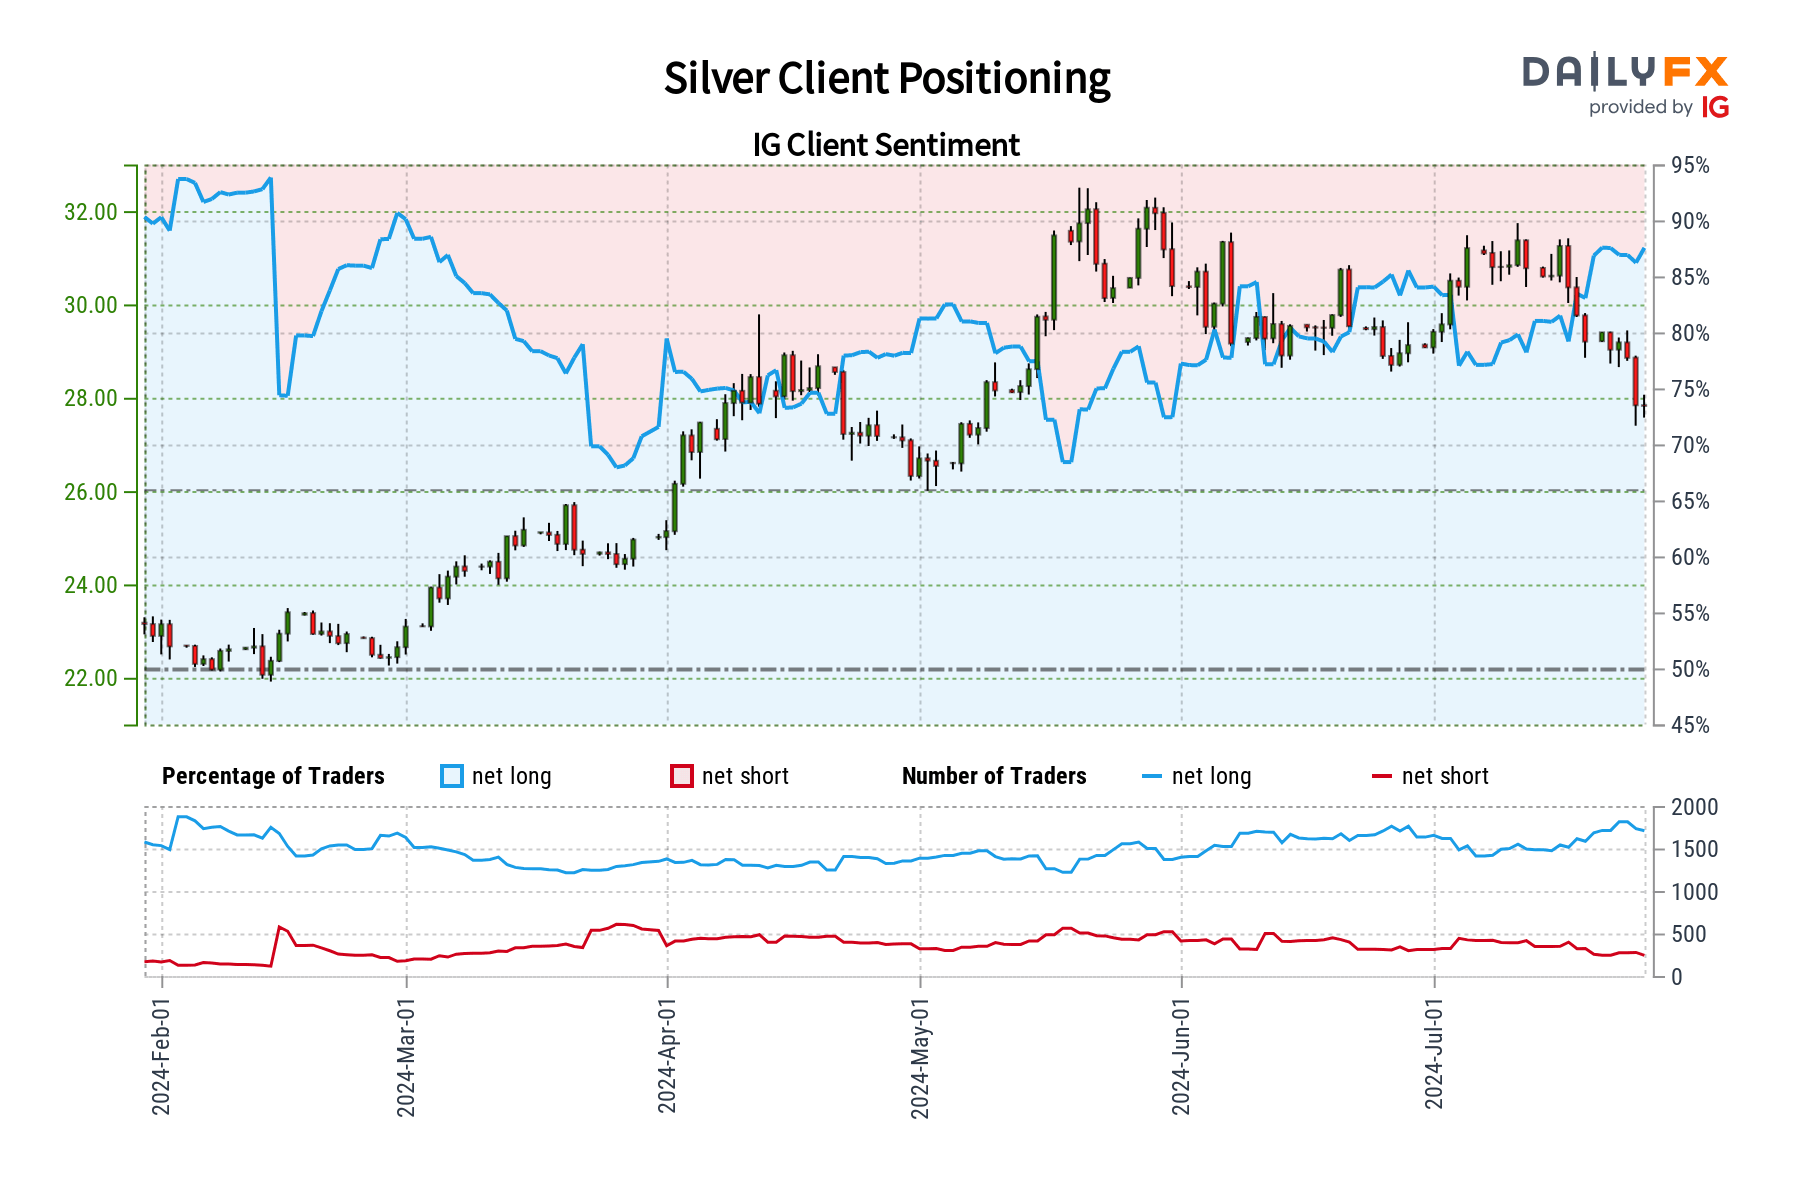
Silver: Retail trader data shows 87.75% of traders are net-long with the ratio of traders long to short at 7.16 to 1. The number of traders net-long is 3.37% higher than yesterday and 3.99% higher from last week, while the number of traders net-short is 1.67% higher than yesterday and 8.96% lower from last week.
We typically take a contrarian view to crowd sentiment, and the fact traders are net-long suggests Silver prices may continue to fall.
Traders are further net-long than yesterday and last week, and the combination of current sentiment and recent changes gives us a stronger Silver-bearish contrarian trading bias.
US 500
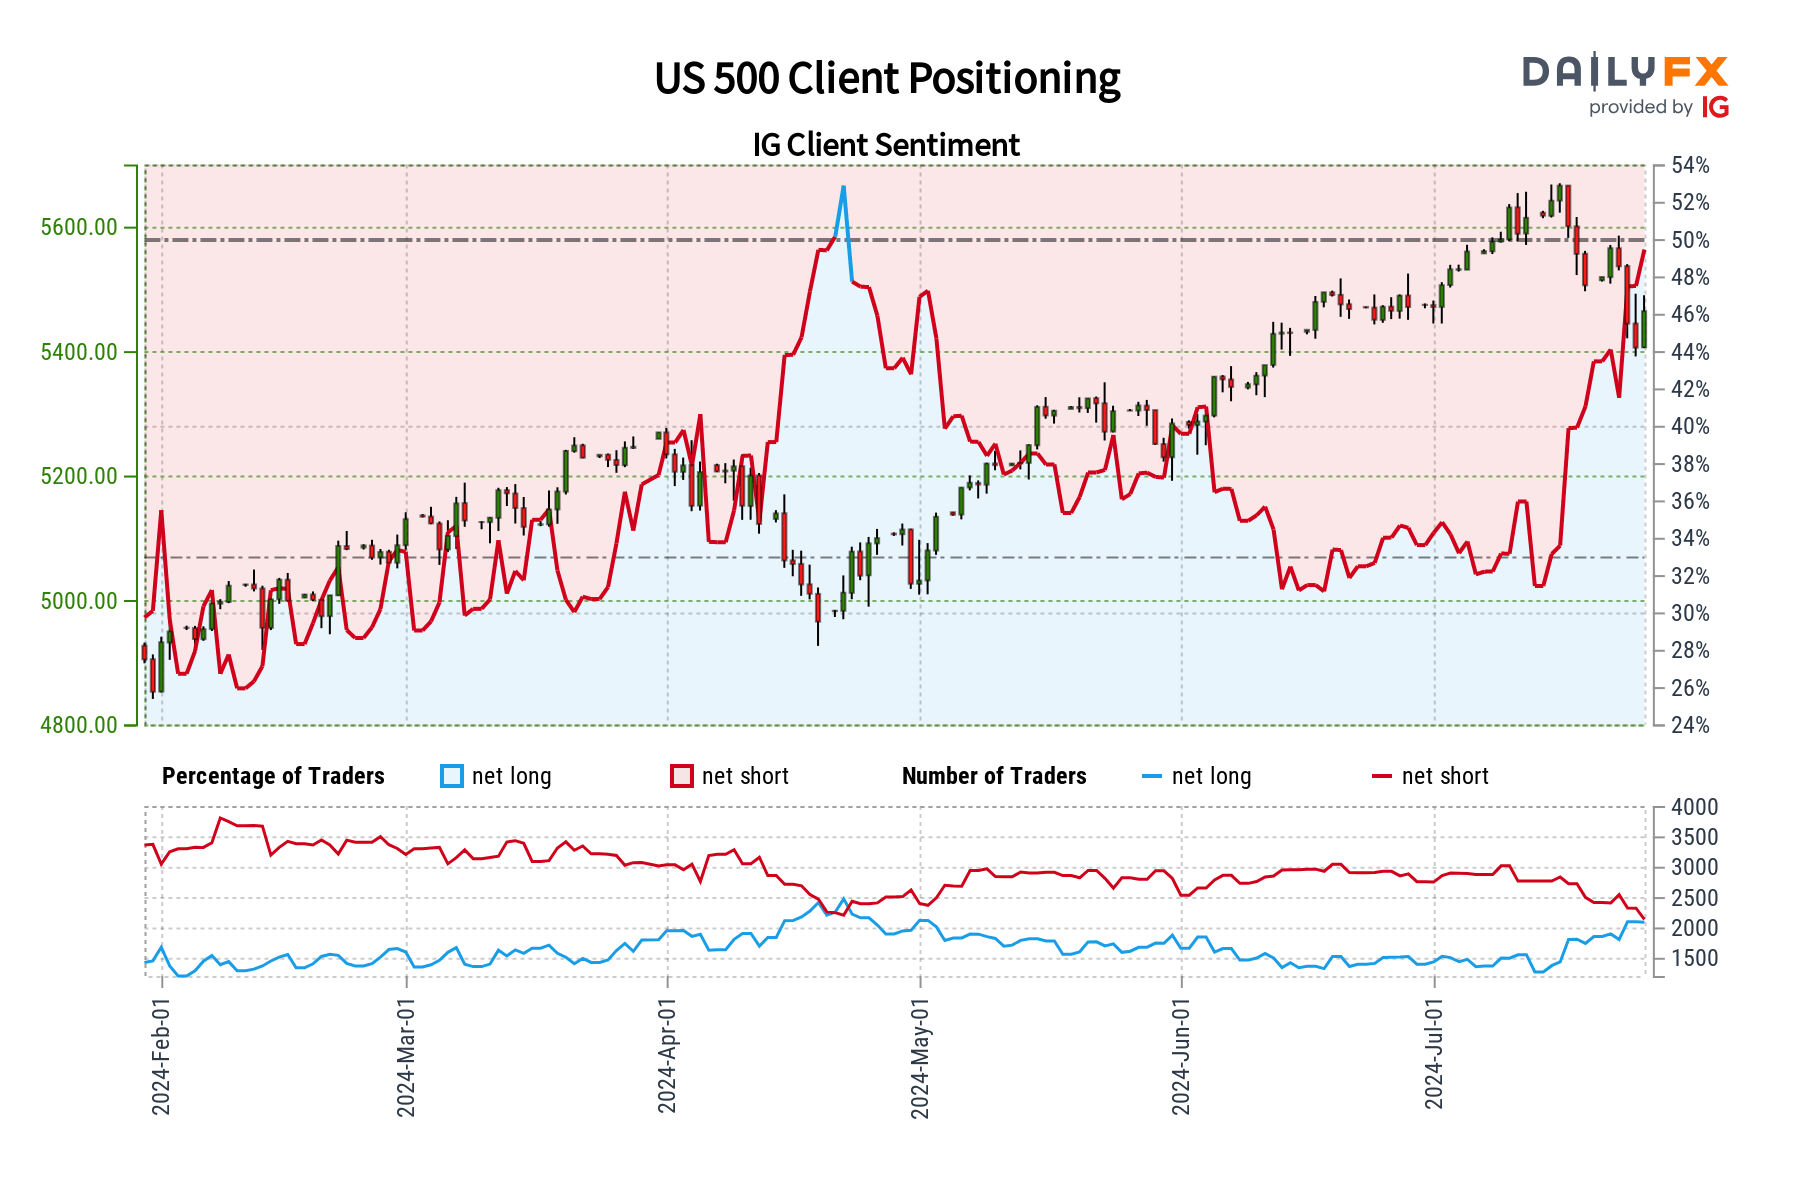
US 500: Retail trader data shows 48.96% of traders are net-long with the ratio of traders short to long at 1.04 to 1. The number of traders net-long is 1.18% higher than yesterday and 15.03% higher from last week, while the number of traders net-short is 0.75% lower than yesterday and 12.67% lower from last week.
We typically take a contrarian view to crowd sentiment, and the fact traders are net-short suggests US 500 prices may continue to rise.
Yet traders are less net-short than yesterday and compared with last week. Recent changes in sentiment warn that the current US 500 price trend may soon reverse lower despite the fact traders remain net-short.
USD/CAD
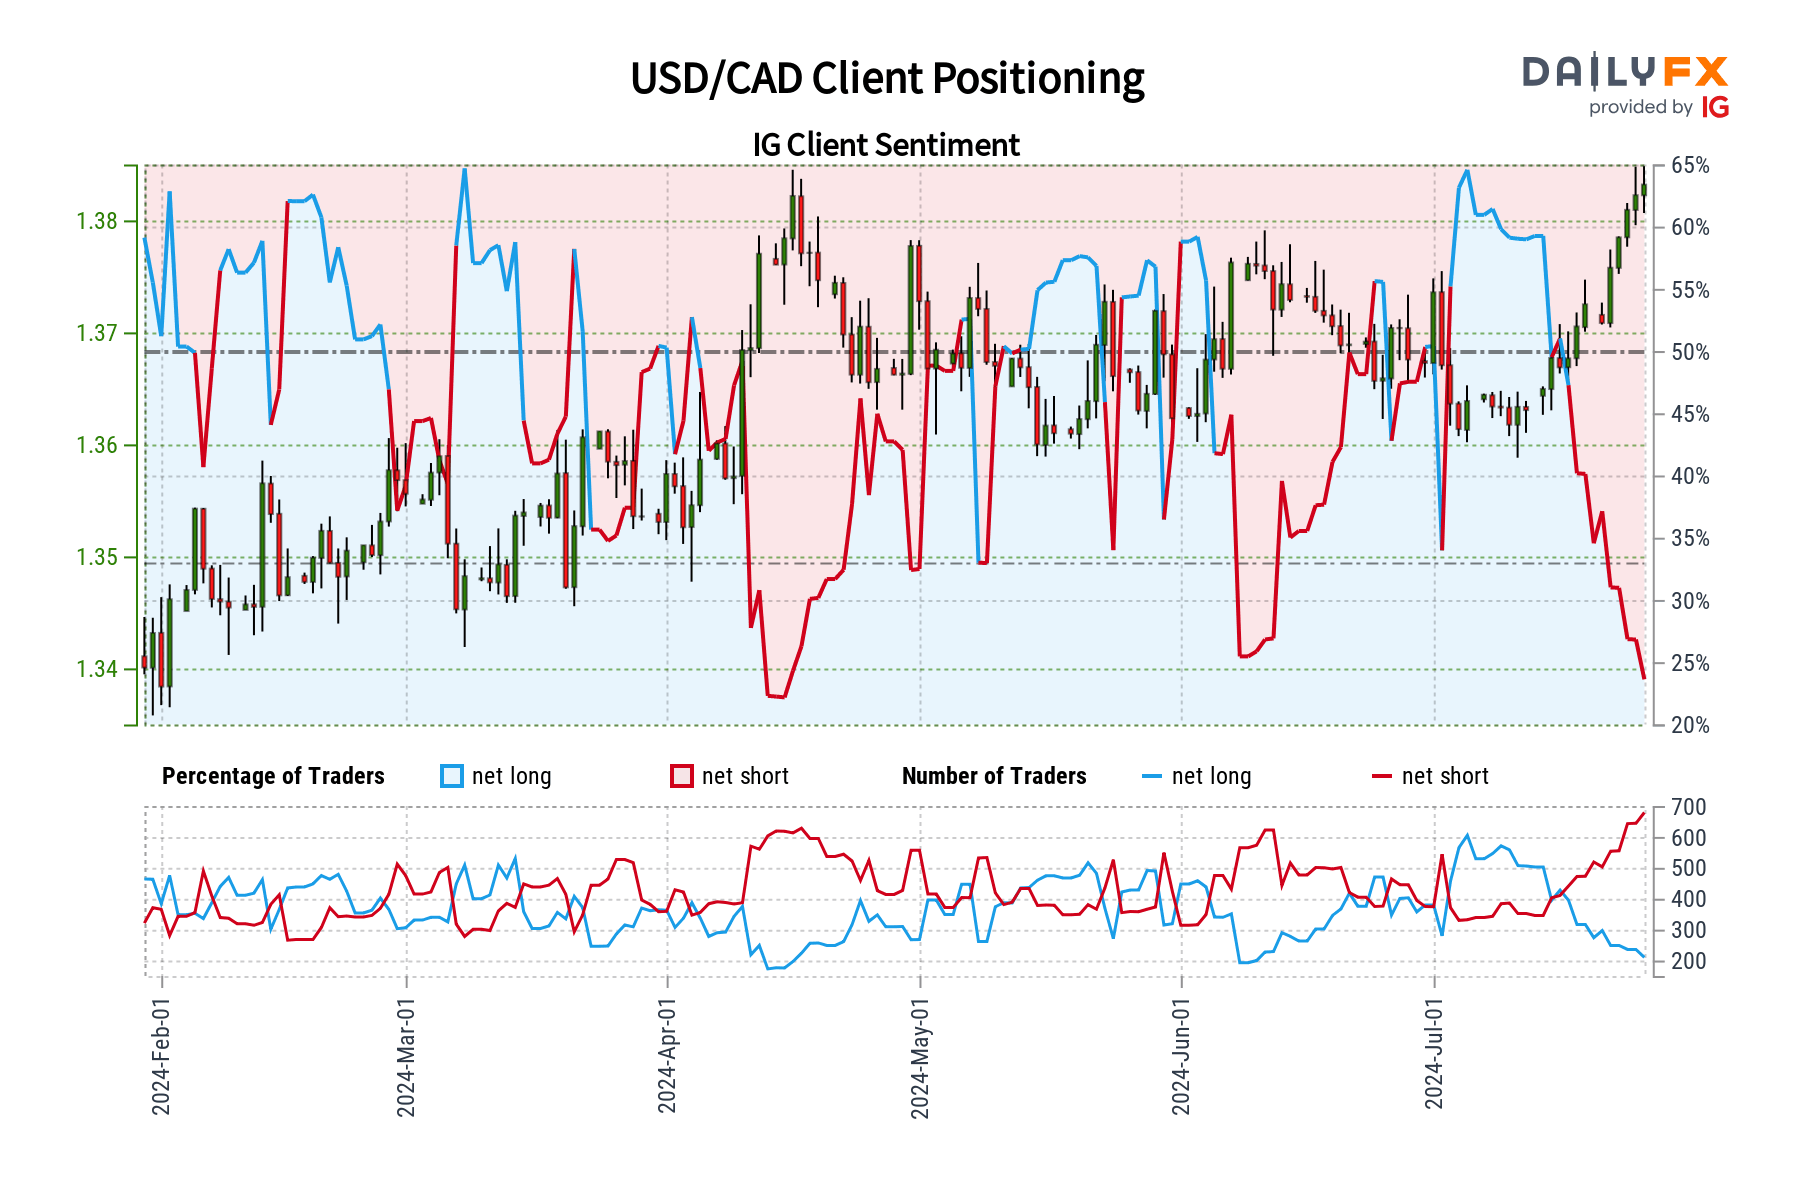
USD/CAD: Retail trader data shows 22.55% of traders are net-long with the ratio of traders short to long at 3.44 to 1. The number of traders net-long is 1.88% lower than yesterday and 30.33% lower from last week, while the number of traders net-short is 6.85% higher than yesterday and 37.55% higher from last week.
We typically take a contrarian view to crowd sentiment, and the fact traders are net-short suggests USD/CAD prices may continue to rise.
Traders are further net-short than yesterday and last week, and the combination of current sentiment and recent changes gives us a stronger USD/CAD-bullish contrarian trading bias.
USD/CHF
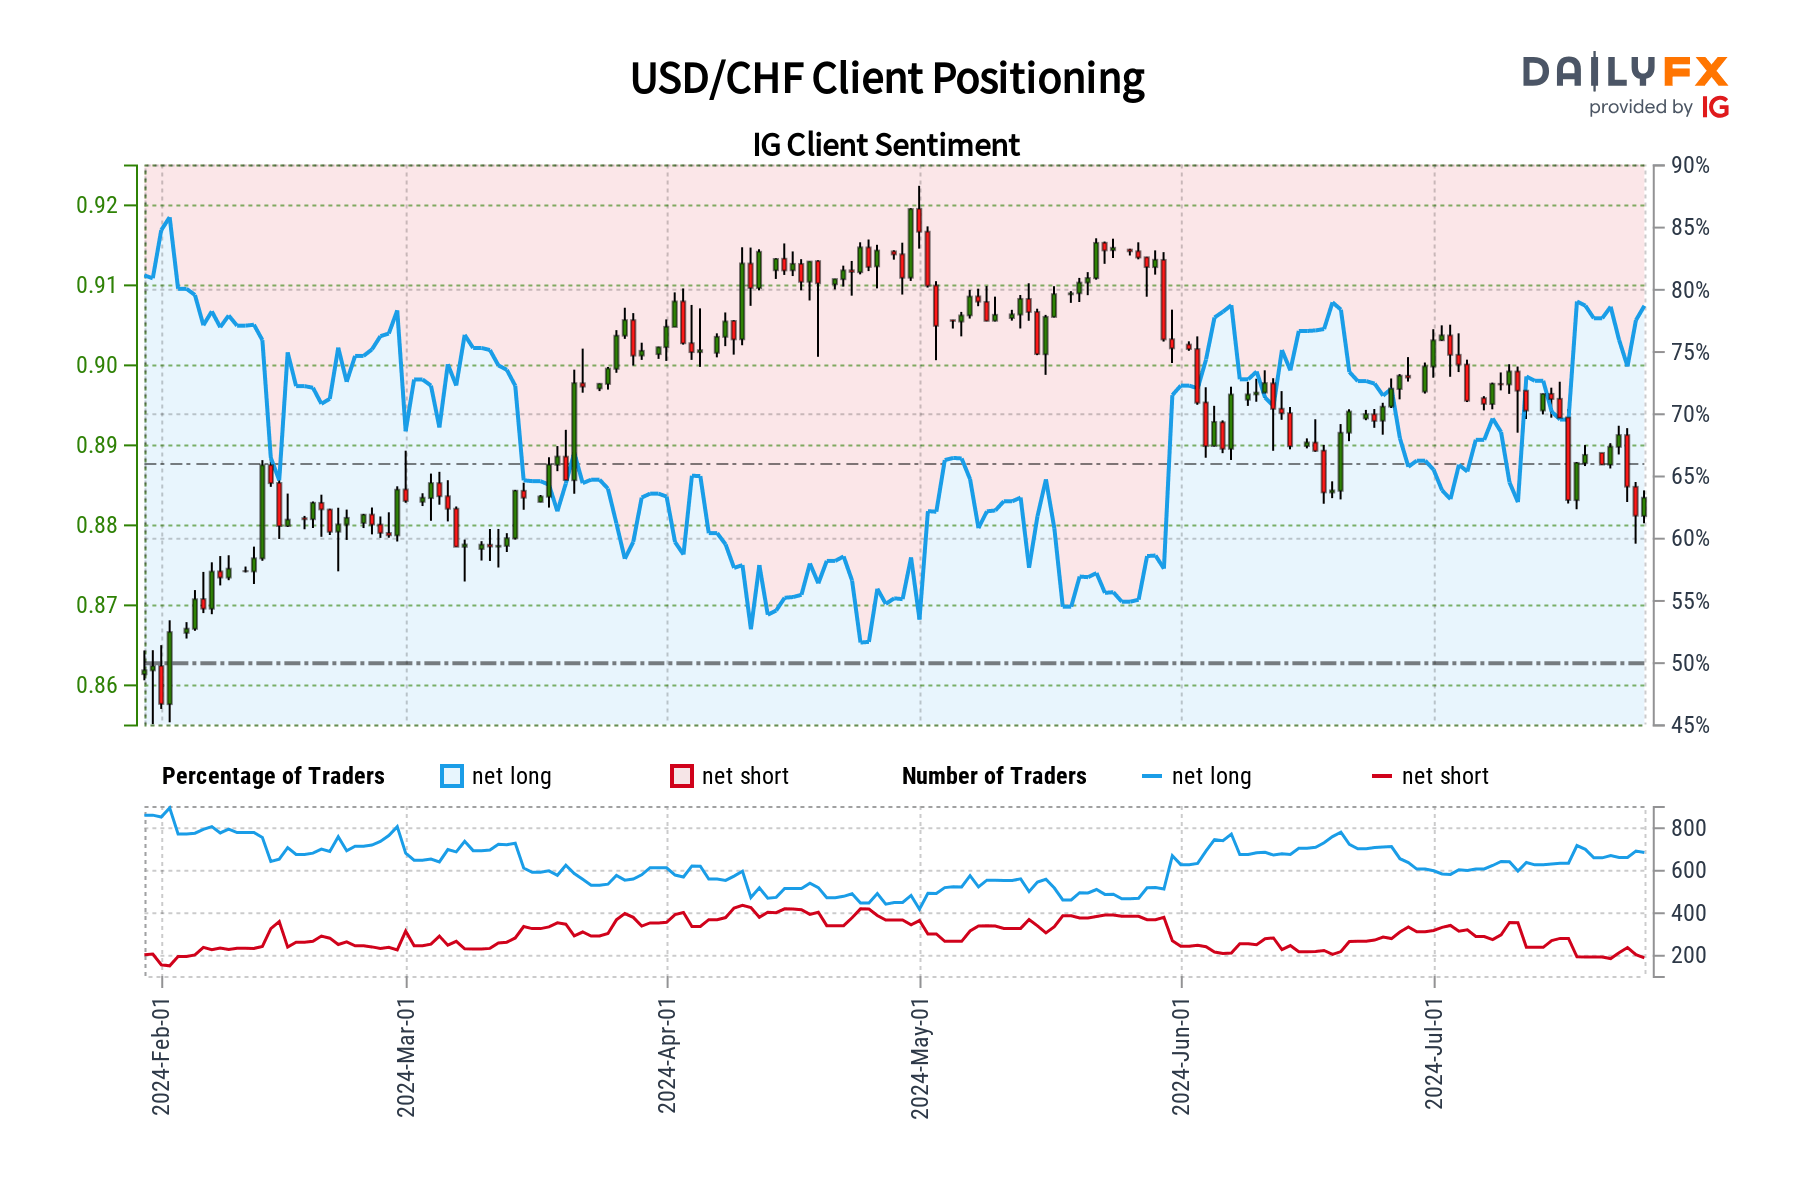
USD/CHF: Retail trader data shows 78.86% of traders are net-long with the ratio of traders long to short at 3.73 to 1. The number of traders net-long is 0.59% lower than yesterday and 1.34% higher from last week, while the number of traders net-short is 1.11% higher than yesterday and 2.15% lower from last week.
We typically take a contrarian view to crowd sentiment, and the fact traders are net-long suggests USD/CHF prices may continue to fall.
Positioning is less net-long than yesterday but more net-long from last week. The combination of current sentiment and recent changes gives us a further mixed USD/CHF trading bias.
USD/JPY
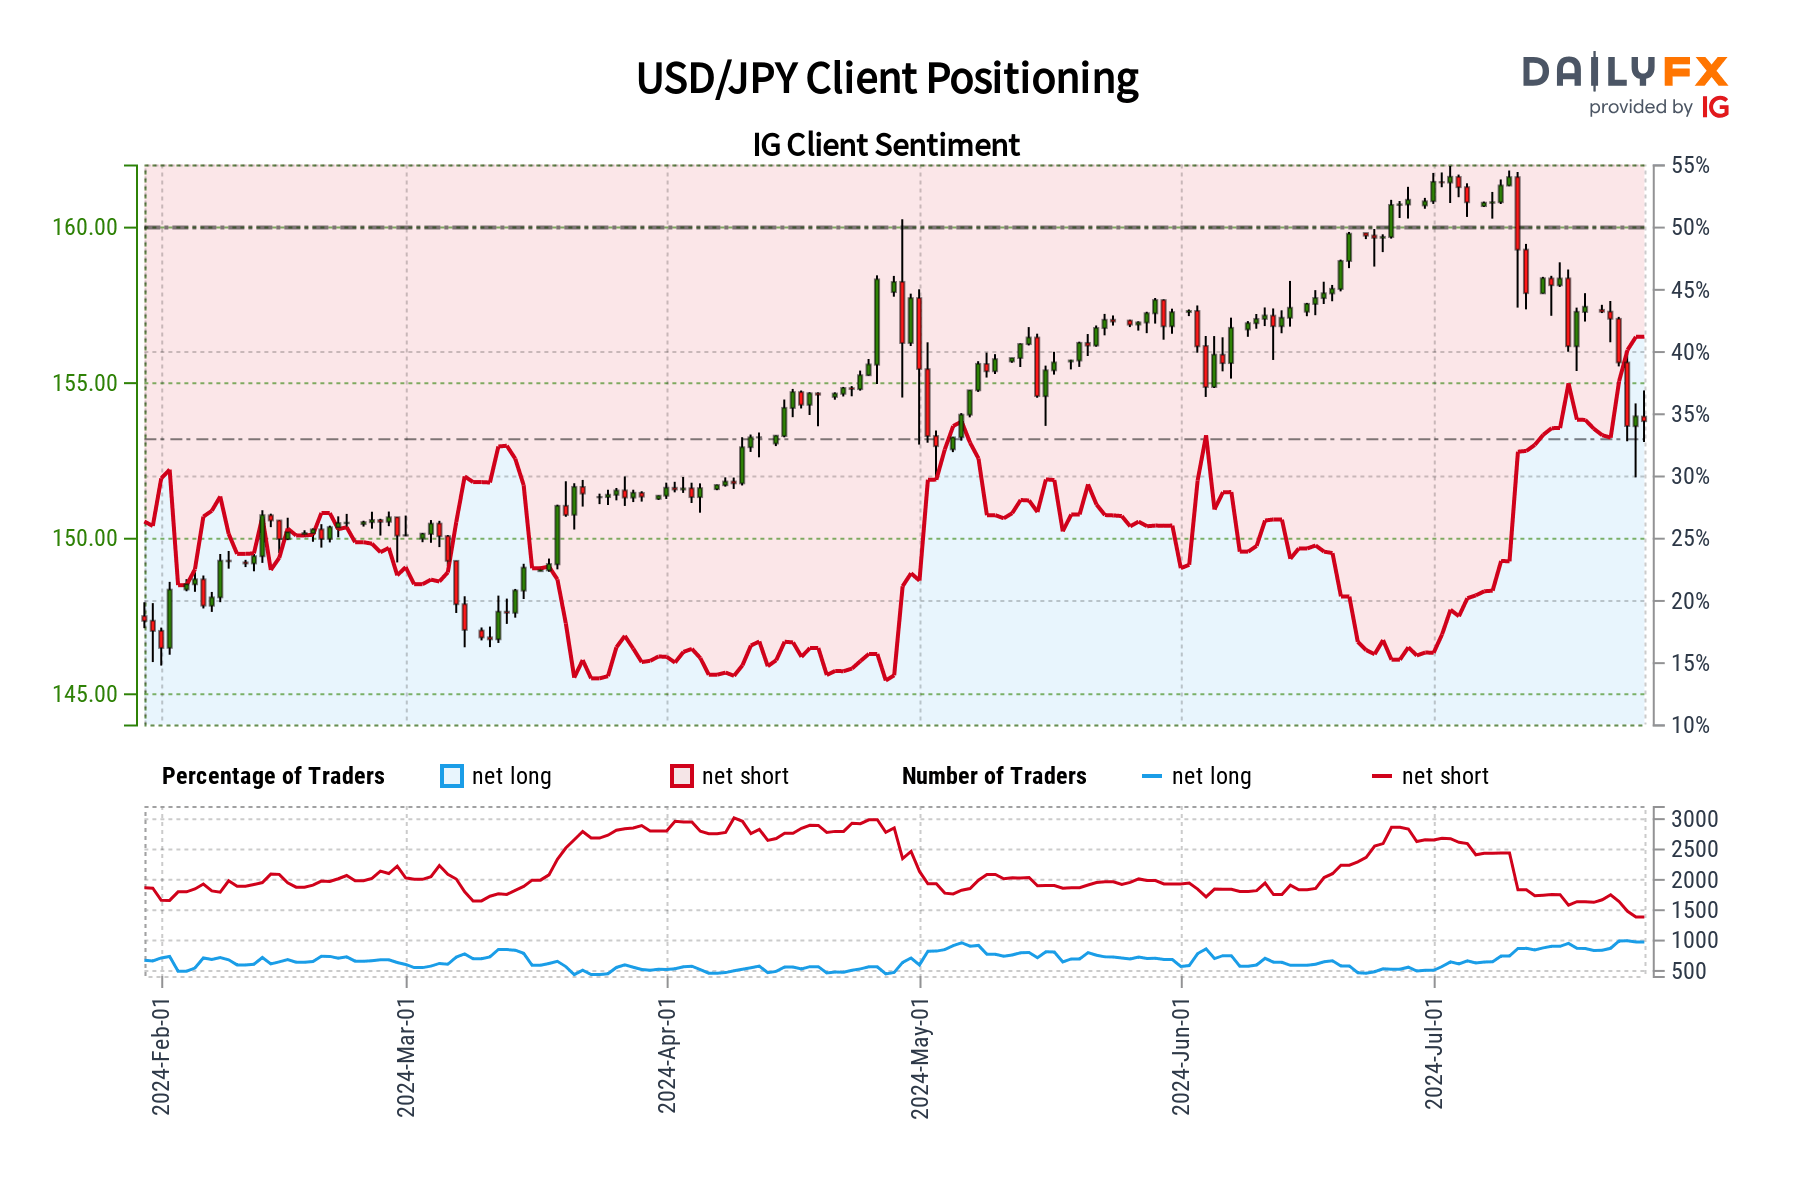
USD/JPY: Retail trader data shows 41.42% of traders are net-long with the ratio of traders short to long at 1.41 to 1. The number of traders net-long is 1.63% lower than yesterday and 12.46% higher from last week, while the number of traders net-short is 1.56% higher than yesterday and 16.45% lower from last week.
We typically take a contrarian view to crowd sentiment, and the fact traders are net-short suggests USD/JPY prices may continue to rise.
Positioning is more net-short than yesterday but less net-short from last week. The combination of current sentiment and recent changes gives us a further mixed USD/JPY trading bias.
Wall Street
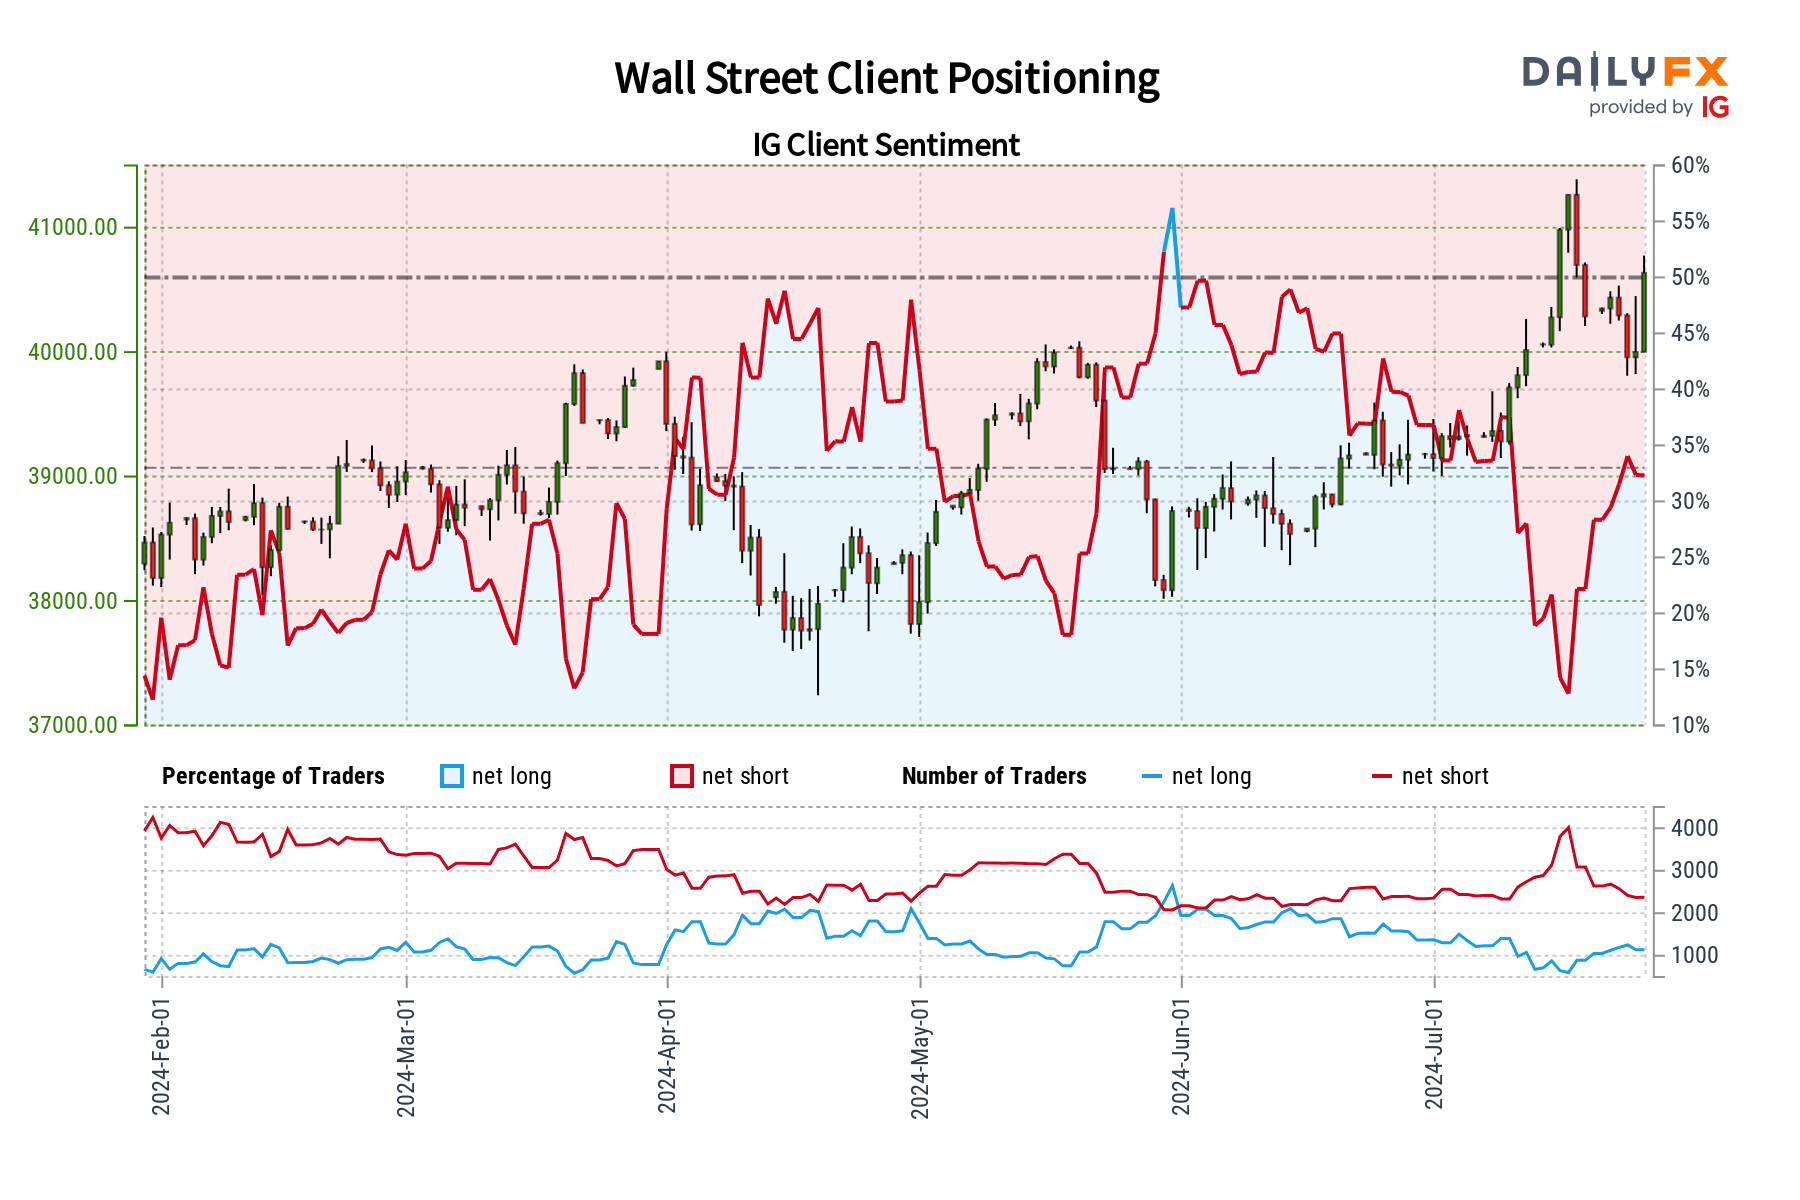
Wall Street: Retail trader data shows 22.41% of traders are net-long with the ratio of traders short to long at 3.46 to 1. The number of traders net-long is 17.70% lower than yesterday and 19.41% lower from last week, while the number of traders net-short is 17.78% higher than yesterday and 14.18% higher from last week.
We typically take a contrarian view to crowd sentiment, and the fact traders are net-short suggests Wall Street prices may continue to rise.
Traders are further net-short than yesterday and last week, and the combination of current sentiment and recent changes gives us a stronger Wall Street-bullish contrarian trading bias.