


S&P 500 Elliott wave patterns point to a correction to relieve the recent buying trend. US Dollar Index appears to be bursting higher out of a triangle pattern.
The video above is a recording of a US Opening Bell webinar from March 11, 2019. We focused on the Elliott Wave patterns for key markets such as SP 500, Nasdaq, DXY, EURUSD, NZDUSD, AUDUSD, USDJPY, NZDUSD, AUDUSD, USDZAR, gold, silver and crude oil.
S&p 500 Pivoted at 78% retracement of 2018 down trend
There are three main Elliott wave patterns we are following for S&P 500. The common thread in these patterns is a near term correction to release buying pressure may be on the horizon. If a correction takes hold, the behavior around the 2525-2625 zone will paint the picture for the next potential move.
Though new highs above the October 3, 2018 high cannot be ruled out, the Elliott wave patterns suggest the current up trend may be the ‘b’ wave of a flat or triangle. If so, then if prices break above the October 3 high, we may see a temporary break followed by a correct back down towards the December low. In essence, this up-trend may be a sucker’s wave higher.
Read more…
Difference Between Dow, Nasdaq, and S&P 500

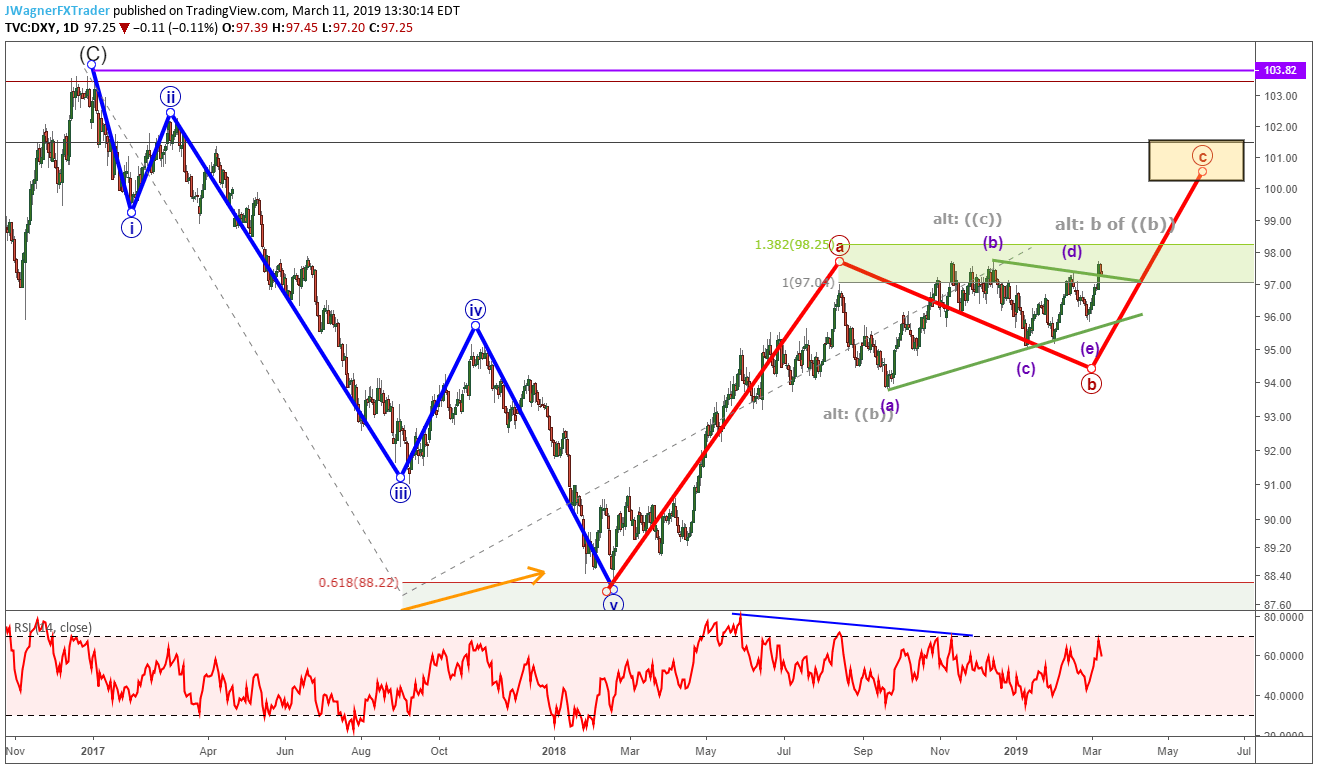
US Dollar Index pops, but upside may be limited
The US Dollar Index rallied last week. The two favored Elliott wave counts we are following suggest a breakout higher may be temporary followed by a minimal retracement back to the 93 handle.
The favored wave picture we are following is that US Dollar Index finished a ‘b’ wave triangle on February 27. This implies a pop higher in the ‘c’ wave of a zigzag pattern. Though DXY has met the minimum levels of this pop higher, it would be normal for this market to scoot higher to 100-101. However, the 2017 high of 103.82 likely holds so upside appears limited.
If a top is formed from not far above current levels, then we’ll consider a deep correction back down to the 93 handle and possibly into the low 80’s for the latter part of calendar year 2019.
Gold price in the middle of a bearish zigzag pattern
In last week’s webinar, we warned of further losses on the horizon for gold and silver. The recent dip in gold prices appears to be wave ‘a’ of a bearish zigzag. That implies wave ‘b’ of the zigzag pops gold prices higher to correct a portion of the February down trend. Once that bounce is exhausted, look for another bearish wave in gold to dig into the mid 1200’s in a final leg of a multi-year triangle. Therefore, gold prices may see 1200-1250 over the coming weeks.
Additional reading…
Top Gold Trading Strategies and Tips
Bitcoin vs Gold: Top Differences Traders Should Know

Elliott Wave Theory FAQ
How does Elliott Wave theory work?
Elliott Wave theory is a trading study that identifies the highs and lows of price movements on charts via wave patterns. Traders analyze the waves for 5-wave moves and 3-wave corrections to determine where the market is at within the larger pattern. Additionally, the theory maintains three rules and several guidelines on the depth of the waves related to one another. Therefore, it is common to use Fibonacci with Elliott Wave analysis. We cover these topics in our beginners and advanced Elliott Wave trading guides.
After reviewing the guides above, be sure to follow future Elliott Wave articles to see Elliott Wave Theory in action.
Not sure if Elliott wave is right for you? Believe it or not, when I first started trading I couldn’t understand why technical analysis worked. Now, I’m 100% technical through Elliott wave. Learn more about how Jeremy got started into Elliott wave from his podcast interview on Trading Global Markets Decoded with Tyler Yell.
---Written by Jeremy Wagner, CEWA-M
Jeremy Wagner is a Certified Elliott Wave Analyst with a Master’s designation. Jeremy provides Elliott Wave analysis on key markets as well as Elliott Wave educational resources. Read more of Jeremy’s Elliott Wave reports via his bio page.
Follow Jeremy on Twitter at @JWagnerFXTrader .
Recent Elliott Wave analysis you might be interested in…
WTI Crude oil Reaches a Decision Point on Price Chart
8 scenarios after an Elliott wave impulse pattern completes
Jeremy’s podcast Interview on his progression to being 100% technical through Elliott wave
USD/JPY Technical Analysis: 3 Year Pattern Complete?
USDZAR Has Biggest Monthly Gain Since August – More to Come?


