


Join Paul Tuesday-Friday for webinars each week, for details please see the Webinar Calendar.
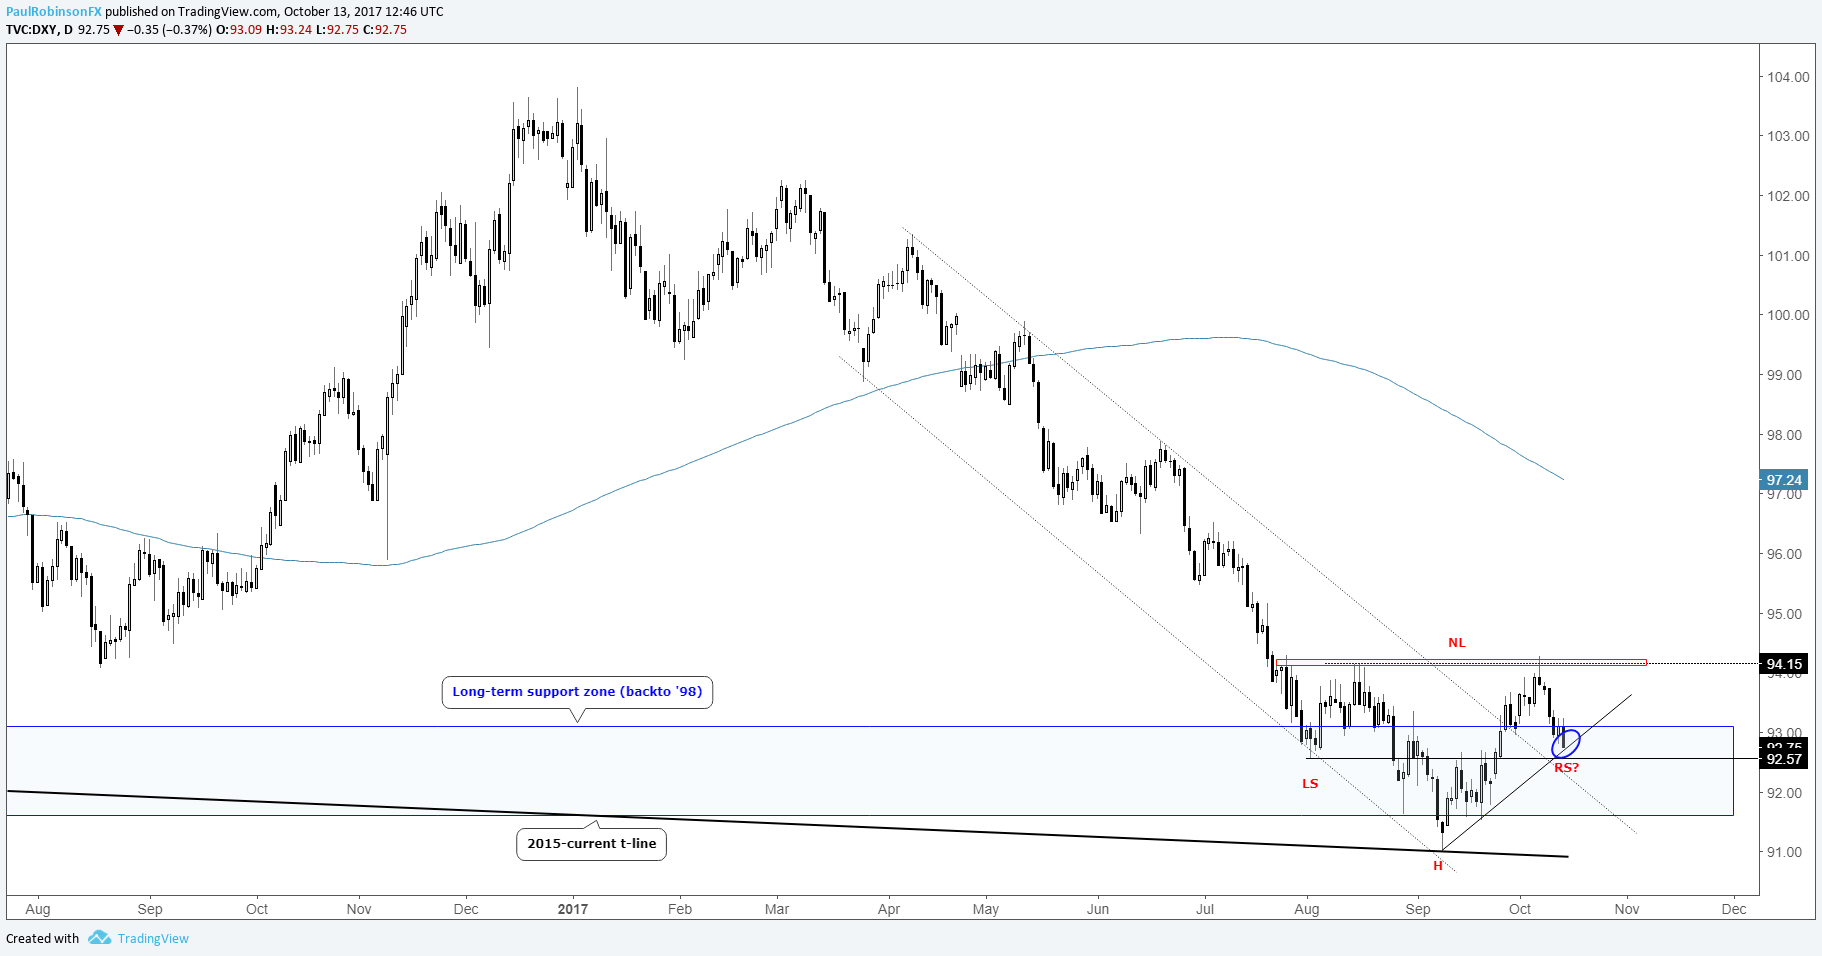
The US Dollar Index (DXY) could soon curl up from what could be a broad ‘inverse head-and-shoulders’ formation. The dollar could still fail here, but given where it taking shape from in a long-term support zone the prospects of seeing an eventual neckline break look promising. But we’ll first need to wait for that to take shape before drawing concrete conclusions about the validity of the formation.
US Dollar Index (DXY): Daily
In flipping the DXY chart upside down we effectively have a chart of the euro, which makes sense given that the single-currency has a 57% weighting in the index. GBPUSD has undergone a strong bounce, with no real levels to operate off of in the vicinity of current levels, but nevertheless cable looks poised to move lower in-line with a generally stronger dollar. Support to watch out for clocks in at a pair of trend-lines dating back to March and April. These fall around the 13000 handle.
EURJPY is riding on a trend-line dating back to June and lately has put it to the test, and if we don’t see a strong reaction off of it then we could see some sizable selling come in. Below 13150 gets it in the clear for downside momentum to likely kick in. CADJPY is testing a trend-line off the June low as well after breaking the neckline of a long-term ‘inverse head-and-shoulders’ pattern. Recent price action is also taking on the shape of a 'bull-flag'.
CADJPY: Daily

Other cross-rates we discussed were NZDJPY, GBPJPY, EURAUD, EURNZD, GBPAUD, and GBPNZD. We also touched on USDMXN as it continues to impress.
Gold is trading around key resistance at 1300 but should we see it turn down with force then we look for renewed weakness to set in. As goes gold goes silver.
Stock indices, what is there to say other than – strong. But knowing that doesn’t really provide much in the way of a trading outlook. It is tough for both sides of the tape as markets are in overbought territory. The Nikkei is ripping to heights not seen since the mid-90s while the S&P 500 and DAX traverse in record territory. We’ll dive deeper in commodities and indices in Tuesday’s webinar
For full technical considerations, please see the video above…
Looking for Ideas? Check out our Trading Guides.
---Written by Paul Robinson, Market Analyst
You can receive Paul’s analysis directly via email by signing up here.
You can follow Paul on Twitter at @PaulRobinonFX.


