Join Paul live for charts and trade set-ups each week, see the Webinar Calendar for details.
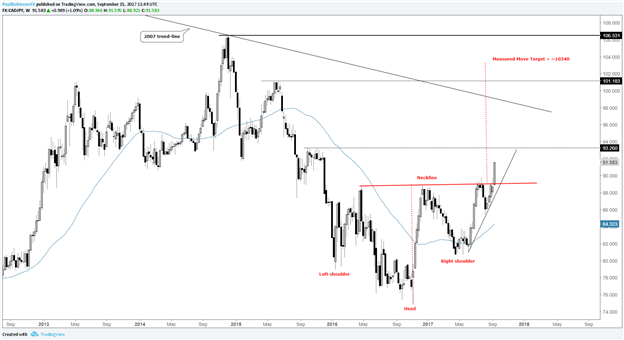
Since January 2016 CADJPY has been in the process of carving out major bottoming formation taking the shape of an inverse head-and-shoulders pattern. It’s indeed an impressively sized configuration with big upside potential. Given its size, a strong weekly close above the neckline was required as an official trigger. Barring a major reversal in the remaining hours of the week we will have such an event.
From a tactical standpoint: This set-up offers opportunity for both long and short-term minded traders. Those looking to establish a long-term holding, then the pattern has been given a green-flag with this week’s breakout bar, with a projected measured move target of roughly 10340. This target is derived by adding the depth of the pattern to the neckline. There are some obstacles along the way towards this target; 9326, 2007 trend-line, and 10118. The measured move target is an approximation based on symmetry and not an actual price level. With that said, the final destination may be a full reversal of the 2014-2016 decline, which clocks in at 10653.
For most of us, we aren’t interested in holding trades for the duration needed to see this one through to the end target. But operating with a top-down approach, we can use this pattern to shape trades on shorter-term time-frames (i.e. – daily, 4-hr). Whether that be through buying dips, breakouts, or other bullish patterns which may develop along the way. The bottom line is that traders can use the path of least resistance identified on the long-term time-frame to put the wind at their back when making shorter-term maneuvers.
Check out this new trading guide - Building Confidence in Trading
CADJPY: Weekly

---Written by Paul Robinson, Market Analyst
You can receive Paul’s analysis directly via email by signing up here.
You can follow Paul on Twitter at @PaulRobinonFX.


