


Gold Technical Price Forecast: XAU/USD Weekly Trade Levels
- Gold price updated trade levels - Weekly Technical Chart
- XAU/USD five-week decline breaks multi-year uptrend– initial support objectives in view
- New to Gold Trading? Get started with this Free How to Trade Gold -Beginners Guide s
Gold prices collapsed more than 18% off the yearly highs with XAU/USD plunging through key technical support last week. A five-week sell-off takes the yellow metal within striking distance of the 2021 lows and while the broader risk now shifts to the downside, the immediate decline may be vulnerable into support just lower with the Federal Reserve interest rate decision on tap next week.These are the updated targets and invalidation levels that matter on the XAU/USD weekly technical price chart. Review my latest Weekly Strategy Webinar for an in-depth breakdown of this gold technical setup and more.
Gold Price Chart - XAU/USD Weekly

Chart Prepared by Michael Boutros, Technical Strategist; Gold on Tradingview
Notes: In my last Gold Weekly PriceOutlook we noted that XAU/USD was, “testing a pivotal level at multi-year trendline support, the last line of defense for the 2018 uptrend- looking for inflection down here.” A clear & well-defined break / close below confluence support at the 2021 low-week close at 1729 prompted another leg lower in price and threatens steeper losses in the weeks ahead.
The next key level of support rests with the May & June 2020 lows / 38.2% Fibonacci retracement of the 2015 rally at 1671/82. This zone converges on channel support over the next few weeks – looking for possible price inflection there IF reached. A break below this threshold would likely fuel another bout of accelerated losses for gold with such a scenario exposing the 2020 March weekly reversal close at 1631. Initial resistance now rests back with the 2018 / 2019 trendline (currently 1740s) backed by the January low-week close at 1791. Broader bearish invalidation now lowered to the 100% extension / 61.8% retracement / 52-week moving average 1818/31.

Bottom line: Gold has plunged through major uptrend support and remains vulnerable to further declines while below the 2018 / 2019 trendline. From at trading standpoint, look to reduce short-exposure / lower protective stops on a stretch towards 1671/82– rallies / recoveries should be capped by 1791 IF price is heading lower on this stretch. Keep in mind that both price and sentiment are reaching extremes here into downtrend support with the FOMC interest rate decision on tap next week. A good time to reduce position size and stay nimble- things could get very interesting here into the Fed. . . Review my latest Gold Price Outlook for a closer look at the near-term XAU/USD technical trade levels.
For a complete breakdown of Michael’s trading strategy, review his Foundations of Technical Analysis series on Building a Trading Strategy
Gold Trader Sentiment – XAU/USD Price Chart
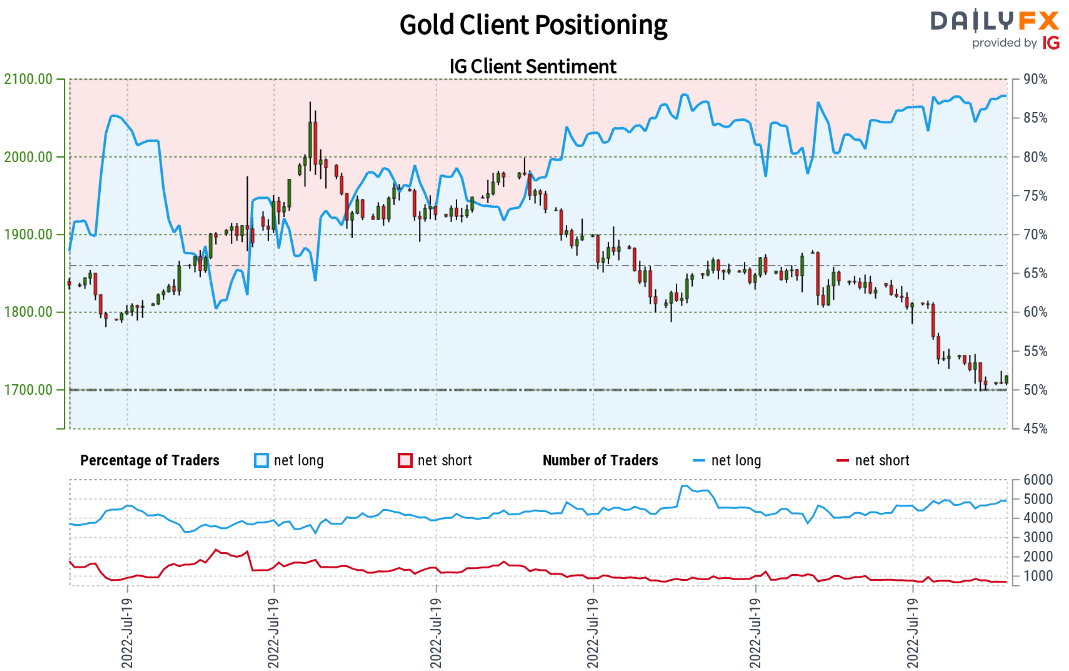
- A summary of IG Client Sentiment shows traders are net-long Gold- the ratio stands at +7.02 (87.53% of traders are long) – typically bearishreading
- Long positions are4.05% higher than yesterday and 7.37% higher from last week
- Short positions are 5.31% higher than yesterday and 20.49% lower from last week
- We typically take a contrarian view to crowd sentiment, and the fact traders are net-long suggests Gold prices may continue to fall. Traders are less net-long than yesterday but more net-long from last week. The combination of current positioning and recent changes gives us a further mixed Gold trading bias from a sentiment standpoint.
| Change in | Longs | Shorts | OI |
| Daily | 3% | -3% | 0% |
| Weekly | 11% | -10% | 1% |
---
Active Weekly Technical Charts
- Australian Dollar (AUD/USD)
- S&P 500, Nasdaq, Dow
- Silver (XAG/USD)
- US Dollar Index (DXY)
- Canadian Dollar (USD/CAD)
- Crude Oil (WTI)
- British Pound (GBP/USD)
- Euro (EUR/USD)
- Written by Michael Boutros, Technical Strategist with DailyFX
Follow Michael on Twitter @MBForex


