


Silver Technical Price Forecast: XAG/USD Weekly Trade Levels
- Silver price updated technical trade levels - Weekly Chart
- XAG/USD attempting to mark seventh weekly sell-off into critical support zone
- Weekly support 18.28/69 (critical), 16.66, 15.47/59 – resistance 20.86-21.13. 23.28 (key)
Silver prices have collapsed more than 19% year-to-date with XAG/USD approaching a key technical confluence– risk for price inflection into this critical pivot zone. These are the updated targets and invalidation levels that matter on the XAG/USD weekly technical price chart. Review my latest Weekly Strategy Webinar for an in-depth breakdown of this silver technical setup and more.
Silver Price Chart - XAG/USD Weekly
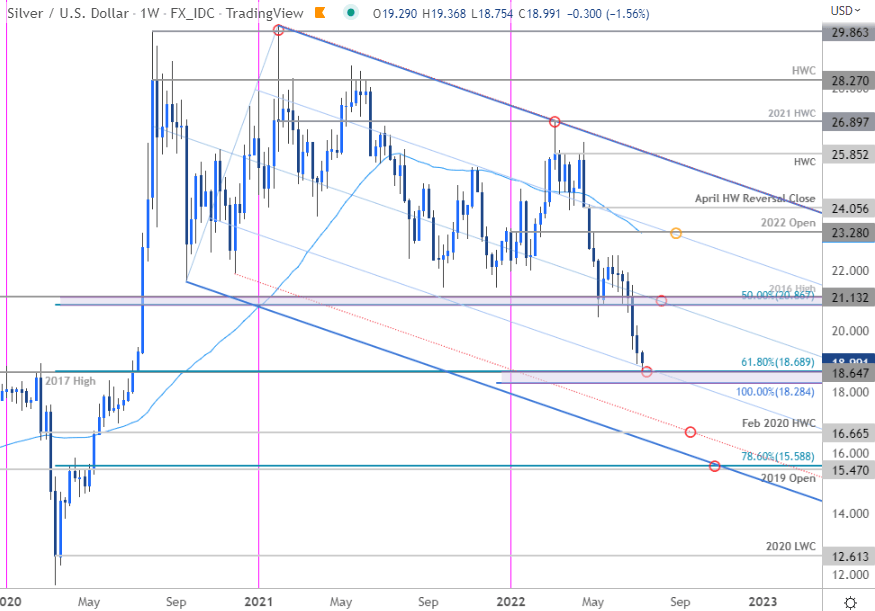
Chart Prepared by Michael Boutros, Technical Strategist; Silver on Tradingview
Notes: Silver is testing a key technical support zone this week at 18.28/69- a region defined by the 100% extension of the 2021 decline, the 2017 swing high and the 61.8% Fibonacci retracement of the 2021 rally. The sell-off is attempting to mark the seventh consecutive weekly decline – a feat not achieved since August of 2018. That instance was a ten-week sell-off which eventually saw another 5.7% decline before registering a multi-year low. Although the broader outlook remains weighted to the downside, we’re on the lookout for possible price inflection into this critical support confluence this week.
A break lower from here would threaten another accelerated decline towards the February 2020 high-week close at 16.66 backed by the objective 2019 yearly open / 78.6% retracement at 15.47/59- both levels of interest for possible downside exhaustion IF reached. Initial resistance is eyed back at 20.86-21.13 with a breach / weekly close above the 52-week moving average / yearly open at 23.22/28 needed to invalidate the yearly downtrend.

Bottom line: Silver is now testing a pivotal support zone and leaves the immediate short-bias vulnerable while above 18.28. From a trading standpoint, a good zone to reduce short-exposure / lower protective stops – rallies should be capped by the objective monthly open at 20.28 IF price is indeed heading lower on this stretch. I’ll publish and updated Silver Price Outlook once we get further clarity on the short-term XAG/USD technical trade levels.
For a complete breakdown of Michael’s trading strategy, review his Foundations of Technical Analysis series on Building a Trading Strategy
Silver Trader Sentiment – XAG/USD Price Chart
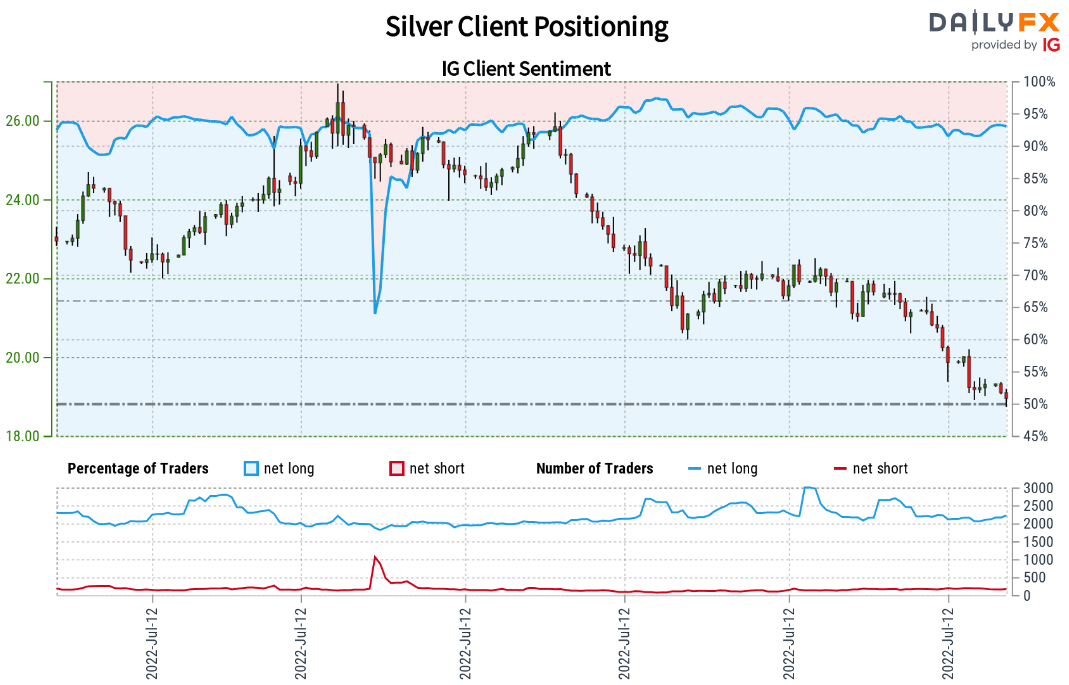
- A summary of IG Client Sentiment shows traders are net-long Silver- the ratio stands at +5.34 (84.24% of traders are long) – typically bearishreading
- Long positions are3.21% lower than yesterday and 2.34% higher from last week
- Short positions are 127.84% higher than yesterday and 101.51% higher from last week
- We typically take a contrarian view to crowd sentiment, and the fact traders are net-long suggests Silver prices may continue to fall. Yet traders are less net-long than yesterday and compared with last week. Recent changes in sentiment warn that the current Silver price trend may soon reverse higher despite the fact traders remain net-long.
| Change in | Longs | Shorts | OI |
| Daily | 1% | -1% | 0% |
| Weekly | -1% | -7% | -4% |
---
Active Weekly Technical Charts
- US Dollar Index (DXY)
- Gold (XAU/USD)
- Canadian Dollar (USD/CAD)
- Crude Oil (WTI)
- British Pound (GBP/USD)
- Euro (EUR/USD)
- S&P 500, Nasdaq, Dow
- Australian Dollar (AUD/USD)
- Written by Michael Boutros, Technical Strategist with DailyFX
Follow Michael on Twitter @MBForex


