


Gold Technical Price Outlook: XAU/USD Short-term Trade Levels
- Gold price updated technical trade levels – Daily & Intraday Charts
- XAU/USD threatens outside-day reversal off downtrend support- threat for larger recovery
- New to Gold Trading? Get started with this Free How to Trade Gold -Beginners Guide
Gold prices have responded to technical downtrend support with today’s post-CPI reversal now threatening a larger recovery within the broader downtrend. These are the updated targets and invalidation levels that matter on the XAU/USD technical charts into the close of the week. Review my latest Strategy Webinar for an in-depth breakdown of this gold technical setup and more.
Gold Price Chart - XAU/USD Daily

Chart Prepared by Michael Boutros, Technical Strategist; Gold on Tradingview
Technical Outlook: In my last Gold Price Outlook we noted that XAU/USD had, “broken to fresh yearly lows and remains at risk for further losses in the days ahead. From a trading standpoint, look to reduce short-exposure / lower protective stops on a stretch towards the lower parallels.” A break lower the following day saw prices plunged another 3.2% with gold registering a low at 1707 on the heels of today’s 40-year high US inflation report. A rally of more than 2.2% off the lows has halted the immediate decline – a near-term exhaustion low? It’s too early to tell but the focus is on a possible outside-daily reversal today IF price is able to close at / above these levels.
Gold Price Chart - XAU/USD 240min
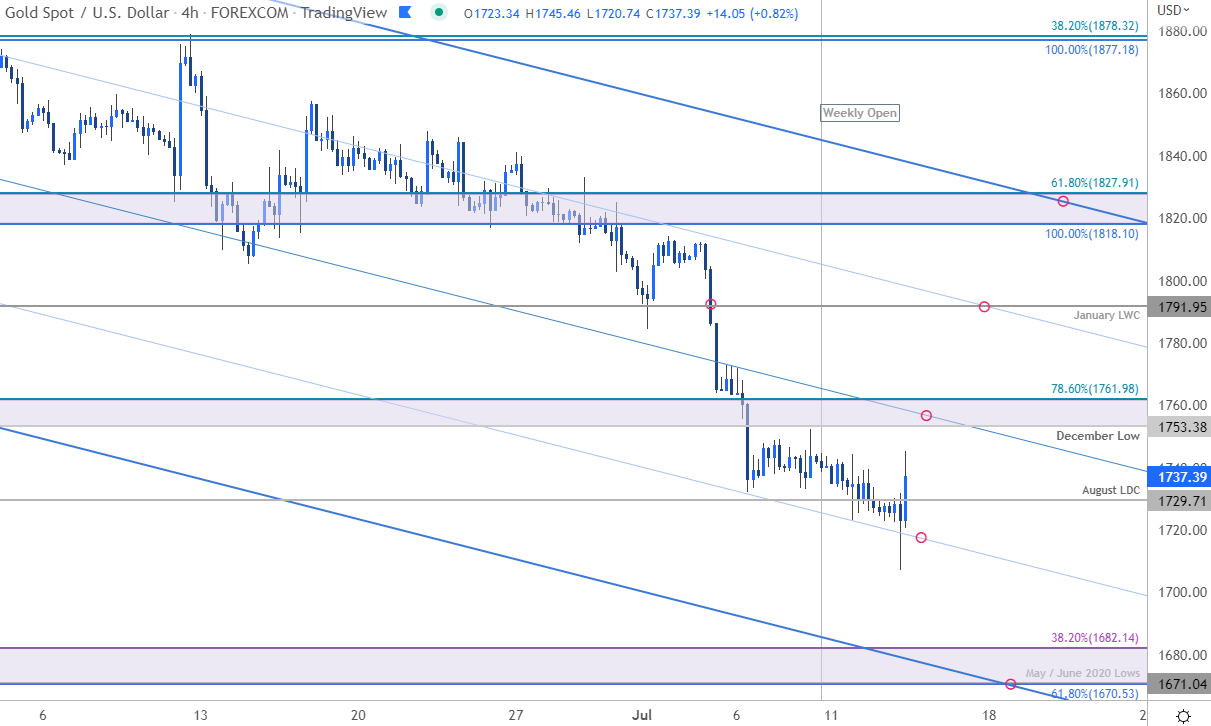
Notes: A closer look at Gold price action highlights last week’s accelerated break below the median-line with sell-off riding along the 25% parallel since the start of the week. Initial resistance now stands back at the December low / 78.6% Fibonacci retracement of the 2021 rally at 1753/61 – a topside breach / close above this threshold would be needed to validate a breakout of the weekly opening-range with such a scenario exposing a possible rally towards the January low-week close at 1791 and broader bearish invalidation at 1818/27. A break lower from here would once again threaten considerable losses for gold towards the next technical support zone at 1670/82.

Bottom line: Gold prices have responded to downtrend support with a daily reversal candle that nearly covers the entire weekly range – the immediate short-bias is vulnerable here. From at trading standpoint, a good zone to reduce short-exposure / lower protective stops – losses should be limited to the 25% parallel (currently ~1715) IF price is heading higher here with a close above 1761 needed to suggest a larger recovery is underway. Review my latest Gold Weekly Price Outlook for a closer look at the longer-term XAU/USD technical trading levels.
For a complete breakdown of Michael’s trading strategy, review his Foundations of Technical Analysis series on Building a Trading Strategy
Gold Trader Sentiment – XAU/USD Price Chart
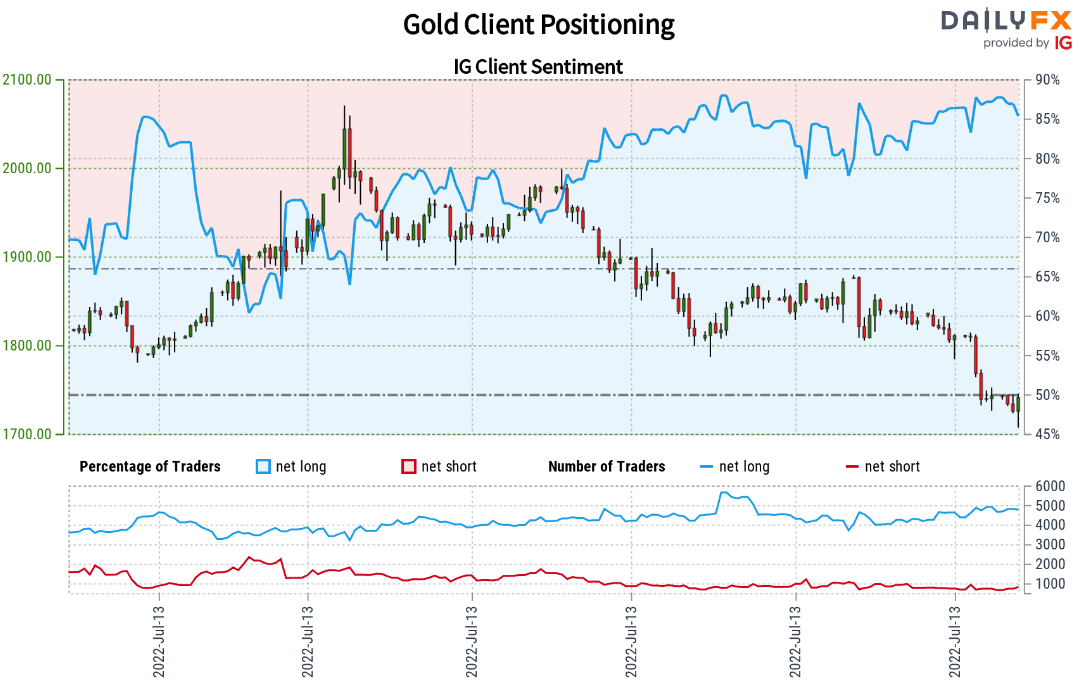
- A summary of IG Client Sentiment shows traders are net-long Gold- the ratio stands at +5.40 (84.37% of traders are long) – typically bearishreading
- Long positions are3.49% lower than yesterday and 3.83% lower from last week
- Short positions are3.22% lower than yesterday and 1.41% lower from last week
- We typically take a contrarian view to crowd sentiment, and the fact traders are net-long suggests Gold prices may continue to fall. Yet traders are less net-long than yesterday and compared with last week. Recent changes in positioning warn that from a sentiment standpoint, the current Gold price trend may soon reverse higher despite the fact traders remain net-long.
| Change in | Longs | Shorts | OI |
| Daily | 1% | -3% | -1% |
| Weekly | 2% | -8% | -2% |
Economic Calendar
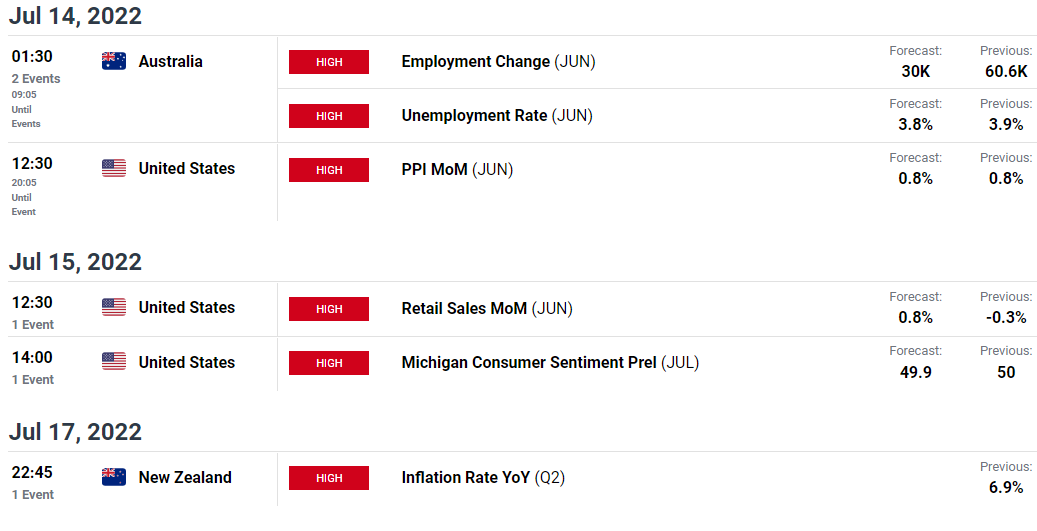
Economic Calendar - latest economic developments and upcoming event risk.
Active Technical Setups
- Written by Michael Boutros, Technical Strategist with DailyFX
Follow Michael on Twitter @MBForex


