


Canadian Dollar Technical Forecast: USD/CAD Weekly Trade Levels
- Canadian Dollar updated technical trade levels - Weekly Chart
- USD/CAD third attempt to breach key resistance fails- rally vulnerable while below weekly high
- Support 1.2784, 1.2675, 1.2640 (critical) – Resistance 1.2975-1.3023 (key), 1.3150s, 1.3230
The Canadian Dollar slipped more than 0.7% against the US Dollar this week with USD/CAD rallying back into a critical resistance zone that has capped the greenback’s advance since the start of the year. While the broader outlook remains constructive, the immediate advance may be vulnerable here again and we’re on the lookout for possible price inflection off this mark. These are the updated targets and invalidation levels that matter on the USD/CAD weekly technical price chart.
Canadian Dollar Price Chart – USD/CAD Weeklys
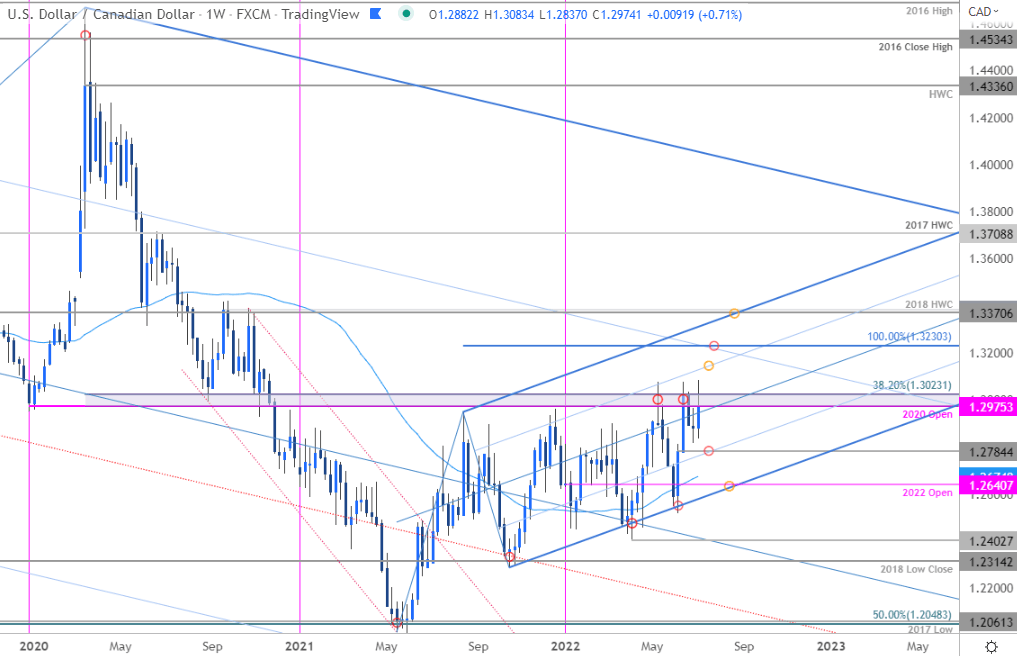
Chart Prepared by Michael Boutros, Technical Strategist; USD/CAD on Tradingview
Notes: In last month’s Canadian Dollar Weekly Technical Forecast we noted that USD/CAD was, “testing a key resistance pivot here– risk for inflection into this region. From at trading standpoint, a good zone to reduce portions of long-exposure / raise protective stops – losses should be limited to 1.27 IF price is indeed heading higher on this stretch with a weekly close above 1.3023 needed to mark resumption of the broader uptrend.” USD/CAD registered an intraweek high at 1.3078 that week before pulling back nearly 2% in the following weeks. Another run-up into the 1.2975-1.3023 resistance zone this week once again failed with this key threshold preserved on the heels of Friday’s US / Canada jobs report. Topside exhaustion again?
Initial weekly support rests with the June low-week reversal close at 1.2784 and is backed by the 52-week moving average, currently near 1.2675. Broader bullish invalidation is set to the lower parallel / 2022 yearly open at 1.2640. A topside breach / close above the 38.2% Fibonacci retracement of the 2020 decline at 1.3023 is needed to mark resumption with such a scenario exposing subsequent resistance objectives at the 75% parallel near 1.3150s and the 100% extension of the 2021 advance at 1.3230- look for a larger reaction there IF reached.

Bottom line: USD/CAD is testing a key resistance pivot for third time here and once again the immediate long-bias may be vulnerable while below. From a trading standpoint, a good zone to reduce long-exposure / raise protective stops – losses should be limited to the 1.2784 IF price is heading higher on this stretch. I’ll publish and updated Canadian Dollar Price Outlook once we get further clarity on the near-term USD/CAD technical trade levels.
For a complete breakdown of Michael’s trading strategy, review his Foundations of Technical Analysis series on Building a Trading Strategy
Canadian Dollar Trader Sentiment – USD/CAD Price Chart

- A summary of IG Client Sentiment shows traders are net-short USD/CAD - the ratio stands at -1.22 (45.15% of traders are long) – typically weak bullish reading
- Long positions are27.80% higher than yesterday and 8.40% higher from last week
- Short positions are 21.61% lower than yesterday and 12.27% lower from last week
- We typically take a contrarian view to crowd sentiment, and the fact traders are net-short suggests USD/CAD prices may continue to rise. Yet traders are less net-short than yesterday and compared with last week. Recent changes in sentiment warn that the current USD/CAD price trend may soon reverse lower despite the fact traders remain net-short.
| Change in | Longs | Shorts | OI |
| Daily | 9% | 4% | 5% |
| Weekly | 10% | 24% | 20% |
US / Canada Economic Calendar

Economic Calendar - latest economic developments and upcoming event risk.
Active Weekly Technical Charts
- Crude Oil (WTI)
- British Pound (GBP/USD)
- Euro (EUR/USD)
- Gold (XAU/USD)
- S&P 500, Nasdaq, Dow
- US Dollar Index (DXY)
- Australian Dollar (AUD/USD)
--- Written by Michael Boutros, Technical Strategist with DailyFX
Follow Michael on Twitter @MBForex


