


Crude Oil Technical Forecast: WTI Weekly Trade Levels
- Crude Oil updated technical trade levels – Weekly Chart
- WTI marking outside-day reversal through support- threat for deeper correction ahead
- New to Oil Trading? Get started with this Free How to Trade Oil-Beginners Guide
Crude oil prices plummeted more than 9% this week with WTI marking its worst single day loss since mid-March . The outside-day reversal takes price to fresh multi-month lows with the breakdown threatening a deeper correction in the days ahead. These are the updated targets and invalidation levels that matter on the oil price weekly technical chart.
Crude Oil Price Chart – WTI Weekly
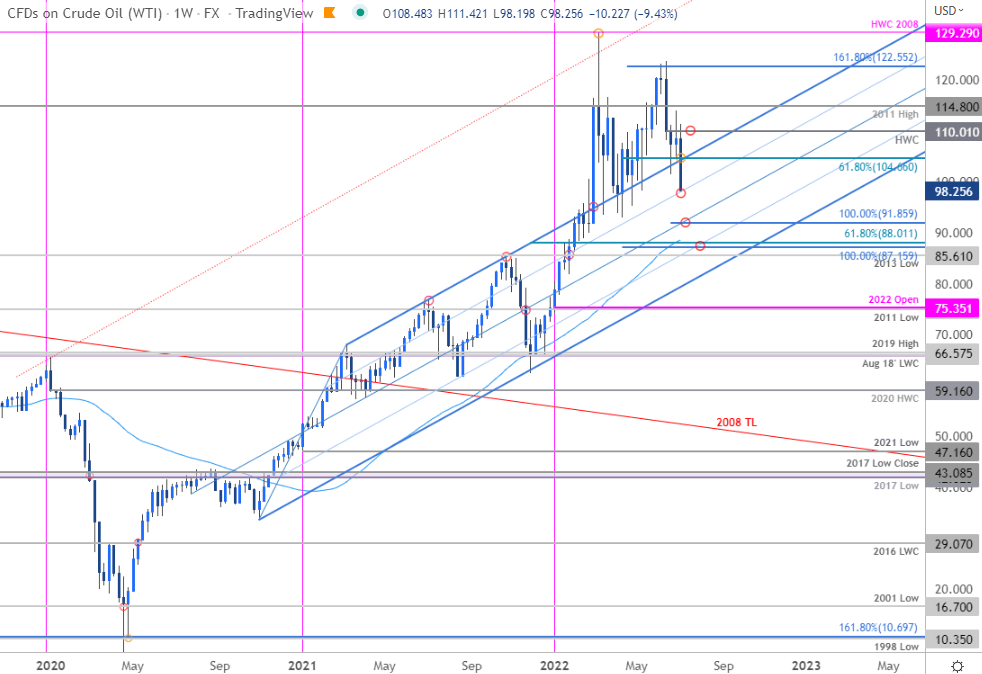
Chart Prepared by Michael Boutros, Technical Strategist; Crude Oil (WTI) on Tradingview
Notes: In last month’s Crude Oil Technical Forecast we noted that the WTI, “breakout is testing initial resistance targets here (122.55). From at trading standpoint, a good zone to raise protective stops – look for downside exhaustion ahead of 109.14 on pullbacks...” Oil briefly registered a high at 123.645 the following week before marking a massive outside-weekly reversal lower with price marking a firm close below 109.14. The break has kept our focus lower in crude with the decline now breaking confluent support this week at the 61.8% Fibonacci retracement of the April rally (104.66)- the correction is underway.
Initial support being tested here at the 75% parallel of the 2020 / 2021 pitchfork with more significant support objectives seen at the 100% ext of the June sell-off (91.86) and a key confluent zone at the 100% extension of the March decline / 61.8% retracement of the November rally / 52-week moving average around 87.15/88.54. Both of these regions represent areas of interest for possible downside exhaustion / price inflection IF reached. Initial weekly resistance back at 104.66 backed by medium-term bearish invalidation now lowered to the June high-week reversal close at 110.01.

Bottom line: The crude oil correction threatens a deeper cut in the weeks ahead- that said, we’re on the lookout for downside exhaustion near key measured levels lower down. From at trading standpoint, a good zone to reduce portions of short-exposure / lower protective stops- rallies should be capped by 110 IF price is heading lower on this stretch with a break exposing measured targets towards 91.86 and beyond. Ultimately, a larger pullback may offer more favorable opportunities closer to uptrend support with a breach / close above 114.80 needed to mark resumption.
For a complete breakdown of Michael’s trading strategy, review his Foundations of Technical Analysis series on Building a Trading Strategy
Crude Oil Trader Sentiment – WTI Price Chart
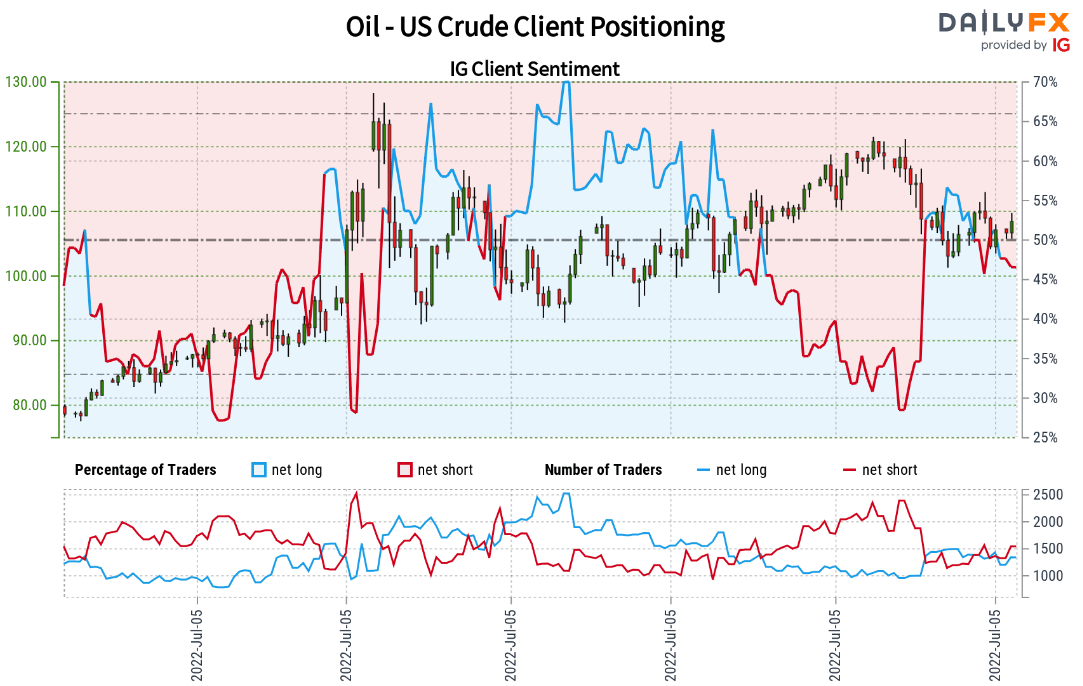
- A summary of IG Client Sentiment shows traders are net-long crude oil - the ratio stands at +1.35 (57.39% of traders are long) – typically weak bearishreading
- Long positions are12.74% higher than yesterday and 11.69% higher from last week
- Short positions are19.83% lower than yesterday and 26.32% lower from last week
- We typically take a contrarian view to crowd sentiment, and the fact traders are net-long suggests Oil - US Crude prices may continue to fall. Traders are further net-long than yesterday and last week, and the combination of current sentiment and recent changes gives us a stronger WTI-bearish contrarian trading bias from a sentiment standpoint.
| Change in | Longs | Shorts | OI |
| Daily | 10% | -2% | 6% |
| Weekly | -7% | 9% | -3% |
---
Active Weekly Technical Charts
- British Pound (GBP/USD)
- Euro (EUR/USD)
- Gold (XAU/USD)
- S&P 500, Nasdaq, Dow
- US Dollar Index (DXY)
- Australian Dollar (AUD/USD)
- Canadian Dollar (USD/CAD)
- New Zealand Dollar (NZD/USD)
- Japanese Yen (USD/JPY)

--- Written by Michael Boutros, Technical Strategist with DailyFX
Follow Michael on Twitter @MBForex


