


Australian Dollar Technical Price Outlook: AUD/USD Weekly Trade Levels
- Australian Dollar technical trade level update - Weekly Chart
- AUD/USD snaps back above key technical pivot zone post-FOMC – risk for larger recovery
- Aussie resistance 7206, 7270/78, 7343/85 (key)- Support 6991-7016 (key), 6827, 6660
The Australian Dollar surged more than 3% off the weekly lows on the heels of the Fed with Aussie snapping back above a key support pivot. The reversal hinges on a weekly close above this threshold and may fuel a larger recovery in the days ahead if achieved. These are the updated targets and invalidation levels that matter on the AUD/USD weekly price charts into the close. Review my latest Weekly Strategy Webinar for an in-depth breakdown of this Aussie technical setup and more.
Australian Dollar Price Chart – AUD/USD Weekly
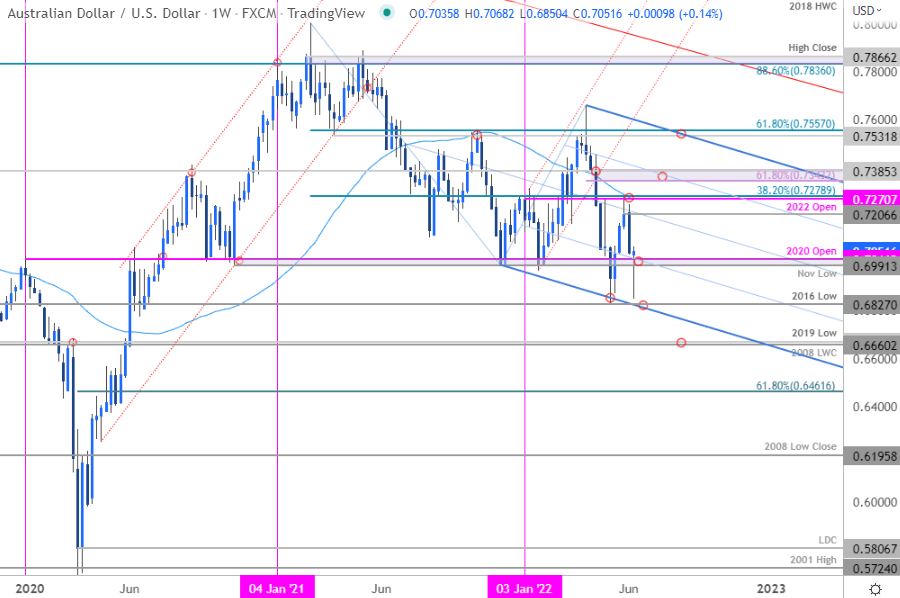
Chart Prepared by Michael Boutros, Technical Strategist; AUD/USD on Tradingview
Notes: In my last AUD/USD Weekly Technical Forecast we warned that, “a rebound off downtrend support takes the Australian Dollar into downtrend resistance early in the month- risk for topside exhaustion into 7288.” Aussie registered a high at 7283 later that week before reversing sharply lower with price plummeting nearly 6% off the highs. The post-FOMC rally has now recovered back above a critical pivot zone we’ve been tracking at 6991-7016 - a region defined by the November 2020 swing low, the objective 2020 yearly open, the 2021 lows and the January low-week close. Was that a near-term exhaustion low?
Initial weekly resistance now eyed at the recent high-week close at 7206 backed by the yearly open / 38.2% Fibonacci retracement of the 2021 decline / 52-week moving average at 7270/78. Ultimately a breach / weekly close above the 61.8% retracement / 2017 low-week close at 7343/85 would be needed to suggest a more significant low was register this week. A close below 6991 this week would keep the focus on subsequent support objectives into the 2016 low at 6827, the lower parallel and the 2008 low-week close / 2019 low at 6660/70.

Bottom line: This could be a near-term exhaustion low in Aussie and the focus is on the weekly close with respect to 6991-7016. From a trading standpoint, a close above this threshold would risk a larger recovery towards downtrend resistance near the 72-handle. On the other-side of 6991, and things could fall apart rather quickly- stay nimble here. The economic docket is light next week so we’ll continue to track price action closely into the open on Sunday. I’ll publish an updated Australian Dollar Price Outlook once we get further clarity on the near-term AUD/USD technical trade levels.
For a complete breakdown of Michael’s trading strategy, review his Foundations of Technical Analysis series on Building a Trading Strategy
Australian Dollar Trader Sentiment – AUD/USD Price Chart
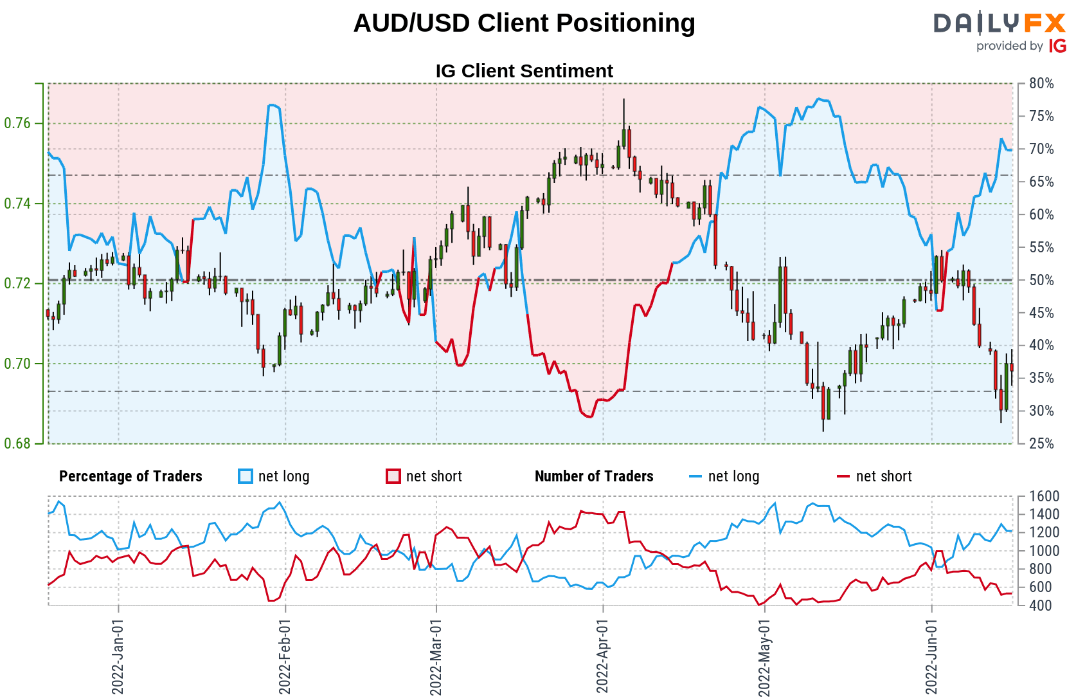
- A summary of IG Client Sentiment shows traders are net-long AUD/USD - the ratio stands at +2.13 (68.09% of traders are long) – typically bearish reading
- Long positions are 3.26% lower than yesterday and 14.65% higher from last week
- Short positions are8.14% higher than yesterday and 21.11% lower from last week
- We typically take a contrarian view to crowd sentiment, and the fact traders are net-long suggests AUD/USD prices may continue to fall. Yet traders are less net-long than yesterday but more net-long from last week. The combination of current positioning and recent changes gives us a further mixed AUD/USD trading bias from a sentiment standpoint.
| Change in | Longs | Shorts | OI |
| Daily | 2% | 3% | 2% |
| Weekly | 29% | -46% | 0% |
Active Weekly Technical Charts
- Canadian Dollar (USD/CAD)
- S&P 500, Nasdaq, Dow
- Gold (XAU/USD)
- New Zealand Dollar (NZD/USD)
- Crude Oil (WTI)
- Japanese Yen (USD/JPY)
- Euro (EUR/USD)
- British Pound (GBP/USD)
- US Dollar Index (DXY)
--- Written by Michael Boutros, Technical Strategist with DailyFX
Follow Michael on Twitter @MBForex


