


US Dollar Technical Price Outlook: DXY Weekly Trade Levels
- US Dollar technical trade level update – Weekly Chart
- USD weekly reversal snaps six-week rally – threat for deeper pullback within uptrend
- DXY support 103, 101.79 (key) – Resistance 104.88 (critical), 106.56, 108.09
The US Dollar Index snapped a six-week winning streak with DXY off more than 1.3% to trade at 103.85 ahead of the US close on Friday. The immediate advance may be vulnerable here and a pullback may offer more favorable opportunities closer to trend support. These are the updated technical targets and invalidation levels that matter on the US Dollar Index weekly price chart. Review my latest Strategy Webinar for an in-depth breakdown of thisDXY technical setup and more.
US Dollar Index Price Chart – DXY Weekly
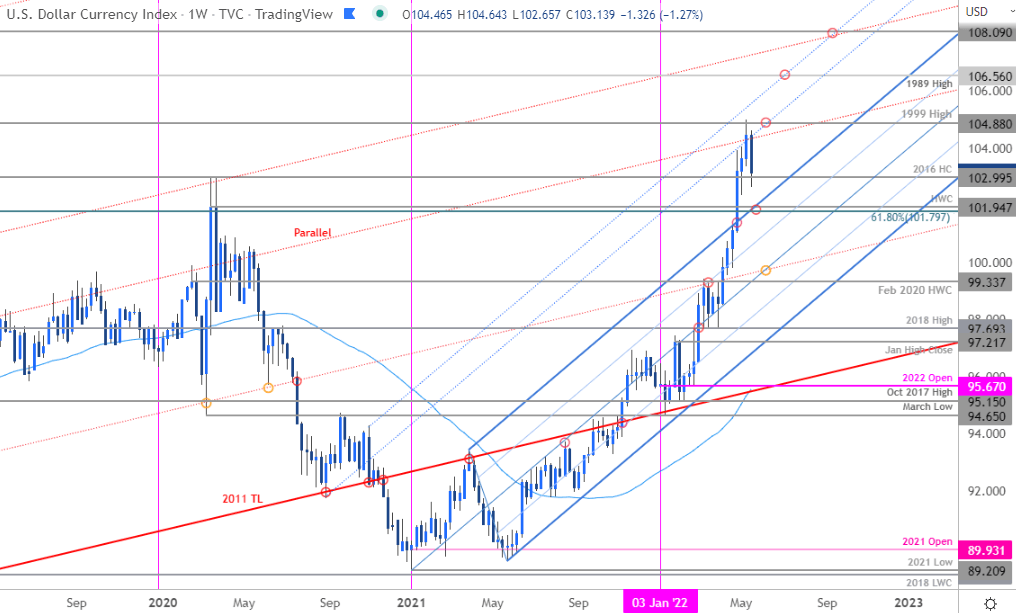
Chart Prepared by Michael Boutros, Technical Strategist; US Dollar Index on Tradingview
Notes: In my last US Dollar Weekly Price Outlook we noted that the DXY rally was approaching uptrend resistance at the, “upper parallel in red (currently ~104.20s) and the 1999 swing high at 104.88- looking for a larger reaction in price there IF reached.” The index registered an intraweek high at 105 before exhausting last week with DXY plunging more than 2.2% off the highs. A turn off confluent resistance highlights the threat for a deeper pullback here within the broader uptrend.
Initial weekly support rests with the 2016 high-close at 103 with near-term bullish invalidation now raised to 101.80/95- a region defined by the 61.8% Fibonacci retracement of the 2001 decline and the 2020 high-week close. Weekly resistance steady at 104.88 with a topside breach / weekly close above needed to mark resumption towards subsequent topside objectives at the 1989 high at 106.56 and the 2001 low at 108.09.
For a complete breakdown of Michael’s trading strategy, review his Foundations of Technical Analysis series on Building a Trading Strategy
Bottom line:The US Dollar has responded to uptrend resistance and while the broader trade remains constructive, the immediate advance may be vulnerable here near-term. From a trading standpoint, be on the lookout for downside exhaustion ahead of 101.80 IF price is indeed heading higher on this stretch with a breach / close above 104.88 needed to mark resumption of the broader uptrend. I’ll publish and updated US Dollar Price Outlook once we get further clarity on the near-term DXY technical trade levels.

Previous Weekly Technical Charts
- S&P 500, Nasdaq, Dow
- New Zealand Dollar (NZD/USD)
- Gold (XAU/USD)
- Crude Oil (WTI)
- Canadian Dollar (USD/CAD)
- British Pound (GBP/USD)
- Australian Dollar (AUD/USD)
- Euro (EUR/USD)
--- Written by Michael Boutros, Technical Strategist with DailyFX
Follow Michael on Twitter @MBForex


