


Gold Technical Price Outlook: XAU/USD Near-term Trade Levels
- Gold price updated technical trade levels – Daily & Intraday Charts
- XAU/USD plummets into downtrend support – threat for bear-market squeeze
- New to Gold Trading? Get started with this Free How to Trade Gold -Beginners Guide
Gold prices are attempting to snap a four-week sell-off with XAU/USD rebounding off technical downtrend support yesterday. The recovery may be short-lived and the immediate focus is on the weekly opening-range taking shape just above trend extremes. These are the updated targets and invalidation levels that matter on the XAU/USD technical charts. Review my latest Strategy Webinar for an in-depth breakdown of this gold technical setup and more.
Gold Price Chart - XAU/USD Daily

Chart Prepared by Michael Boutros, Technical Strategist; Gold on Tradingview
Technical Outlook: In my last Gold Price Outlook we noted that the XAU/USD was in search of a low and to look, “for evidence of an exhaustion low with either a drop into 1818/27 OR a rally through 1897 needed to offer new entry opportunities.” Gold drilled through key support before rebounding sharply off the lower parallel / 2022 low-week close at 1791- that recovery has now taken price back into former support (now resistance) and the focus is on a breakout of the weekly opening-range for guidance.
A topside breach from here would shift the focus towards the 2021 high-week close / 23.6% Fibonacci retracement of the March decline at 1849/53- note that the median-line converges on this threshold over the next few days and a breach / daily close above would be needed to suggest a larger recovery is underway towards 1895/97 and key resistance at 1918 (both areas of interest for possible topside exhaustion IF reached).
Gold Price Chart - XAU/USD 240min

Notes: A closer look at Gold price action shows XAU/USD rebounding off the lower parallel with precision with the rally faltering today into 1827. Initial support steady at 1791 – a break below this threshold would threaten another accelerated decline in gold with such a scenario exposing subsequent support objectives at the November lows at 1758 and the August low-day close at 1729- look for a larger reaction in price there IF reached.

Bottom line: The gold plunge has rebounded off downtrend support and threatens a recovery within the broader decline. From a trading standpoint, a good region to reduce portions of short-exposure / lower protective stops – rallies should be capped by the median-line IF price is heading lower on this stretch with a close below 1791 needed to mark resumption of the broader downtrend. For now- look for a break of the weekly opening-range for guidance. Review my latest Gold Weekly Price Outlook for a closer look at the longer-term XAU/USD technical trading levels.
For a complete breakdown of Michael’s trading strategy, review his Foundations of Technical Analysis series on Building a Trading Strategy
Gold Trader Sentiment – XAU/USD Price Chart

- A summary of IG Client Sentiment shows traders are net-long Gold- the ratio stands at +5.63 (84.93% of traders are long) – typically bearishreading
- Long positions are3.91% higher than yesterday and 1.31% higher from last week
- Short positions are4.77% higher than yesterday and 10.12% lower from last week
- We typically take a contrarian view to crowd sentiment, and the fact traders are net-long suggests Gold prices may continue to fall. Traders are less net-long than yesterday but more net-long from last week. The combination of current positioning and recent changes gives us a further mixed Gold trading bias from a sentiment standpoint.
| Change in | Longs | Shorts | OI |
| Daily | 1% | -3% | -1% |
| Weekly | 2% | -8% | -2% |
Economic Calendar
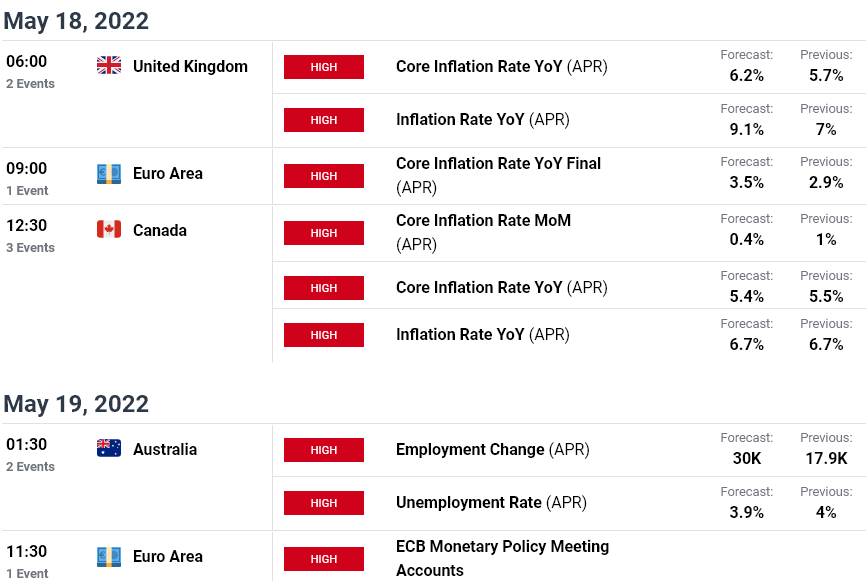
Economic Calendar - latest economic developments and upcoming event risk.
Active Technical Setups
- Canadian Dollar Technical Outlook: USD/CAD Rally Pushing Seven Weeks
- EUR/USD Technical Price Outlook: Euro May Crunch- Breakout Imminent
- S&P 500 Technical Outlook: SPX500 Stock Plunge- Flush Not Finished Yet
- Australian Dollar Technical Outlook: Aussie Recovery to be Short-Lived
- Written by Michael Boutros, Technical Strategist with DailyFX
Follow Michael on Twitter @MBForex


