


S&P 500, Nasdaq & Dow Technical Price Outlook: Weekly Trade Levels
- S&P 500, Nasdaq & Dow technical trade level update – Weekly Charts
- SPX500 plunge testing key support zone near 3924
- Nasdaq held above confluent support at 11520/768
- Dow sell-off approaching key support at 30812
Stocks have been in free-fall since breaking multi-year uptrend support early in the month and while the broader outlook remains tilted to the downside, the sell-off is now approaching areas of interest for possible near-term support in the week ahead. These are the targets and invalidation levels that matter on the S&P 500 (SPX500), Nasdaq (NDX) and the Dow Jones Industrial Average (US30) weekly technical price charts. Review my latest Strategy Webinar for an in-depth breakdown of these technical stock setups and much more.
S&P 500 Price Chart – SPX500 Weekly

Chart Prepared by Michael Boutros, Technical Strategist; SPX500 on Tradingview
Technical Outlook: In last month’s S&P500 Technical Outlook we noted that SPX500 had, “turned from key technical resistance three weeks ago with the pullback now searching for a test of longer-term, uptrend support.” That slope broke the following week with the decline taking another 9% drop into confluence support here at the 100% extension of the yearly decline at 3924- looking for possible inflection here.
A break / close below is needed to keep the immediate short-bias viable towards the 38.2% Fibonacci retracement of the 2019 rally at 3812 and the objective 2021 yearly open at 3734- an area of interest for possible downside exhaustion IF reached. Initial resistance now eyed with the May open at 4140 backed by 4341. Bearishinvalidation now lowered to the 52-week moving average at ~4431.

Bottom line: The S&P 500 is poised to mark a seventh consecutive weekly decline with price now challenging confluent downtrend support- risk for a bear-market bounce here. From a trading standpoint, a good zone to reduce portions of short-exposure / lower protective stops- rallies should be capped by 4341 IF price is indeed heading lower on this stretch with a close below 3924 needed to keep the focus on objectives into the lower parallel near ~3800. Review my latest S&P 500 Near-term Technical Outlook for a closer look at the near-term SPX500 technical trade levels.
S&P 500 Trader Sentiment – SPX500 Price Chart
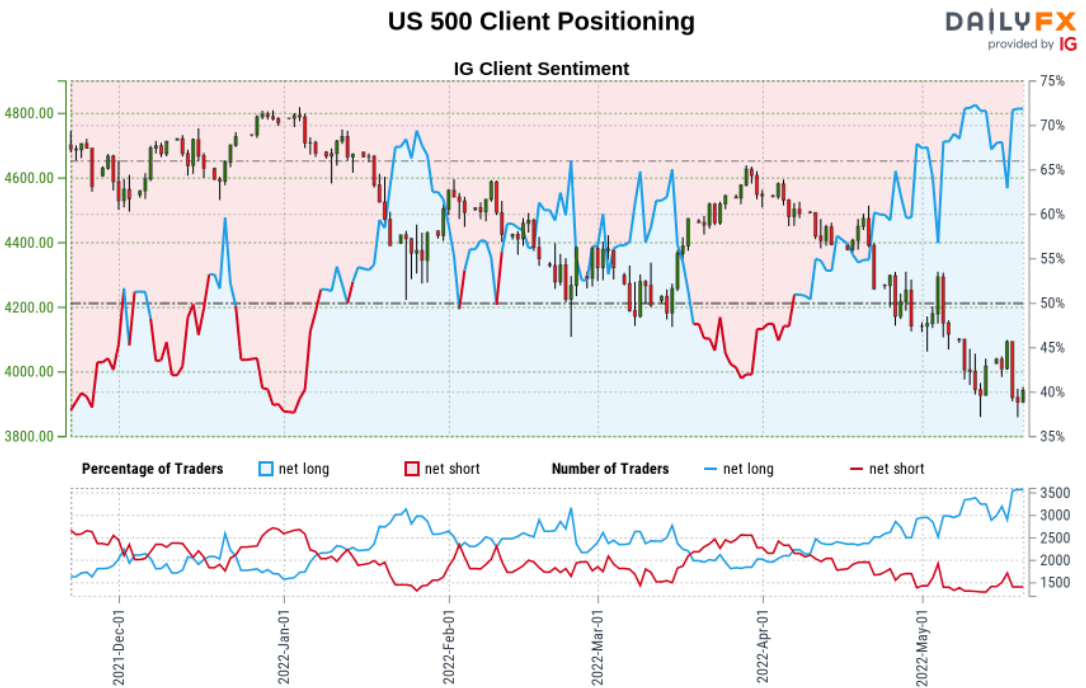
- A summary of IG Client Sentiment shows traders are net-long the S&P 500- the ratio stands at +2.42 (70.72% of traders are long) – typically a bearishreading
- Long positions are1.83% higher than yesterday and 8.58% higher from last week
- Short positions are 4.60% lower than yesterday and 2.79% higher from last week
- We typically take a contrarian view to crowd sentiment, and the fact traders are net-long suggests US 500 prices may continue to fall. Traders are further net-long than yesterday and last week, and the combination of current positioning and recent changes gives us a stronger US 500-bearish contrarian trading bias from a sentiment standpoint.

Nasdaq 100 Price Chart – NDX Weekly
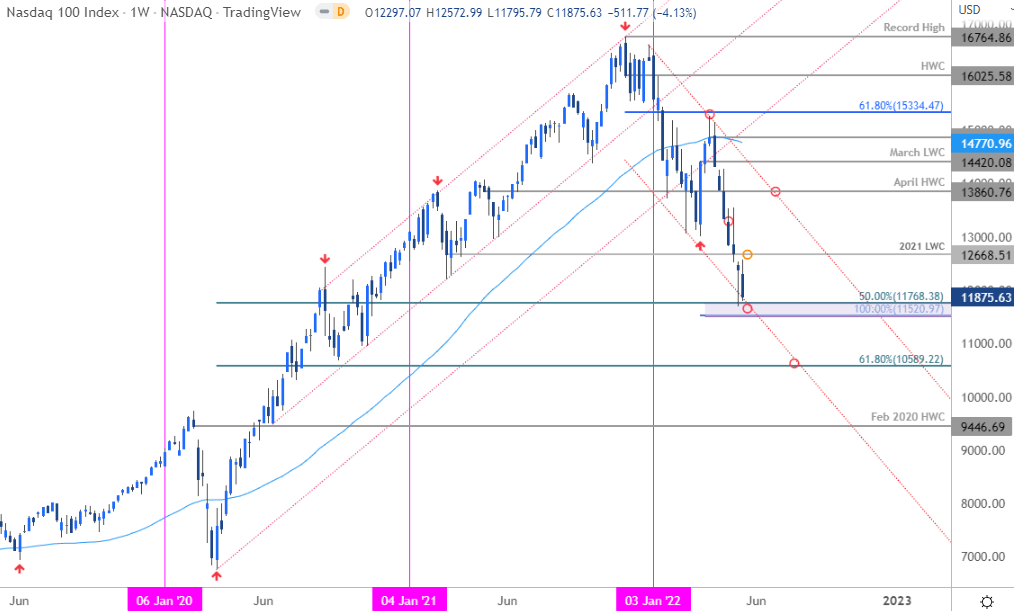
Chart Prepared by Michael Boutros, Technical Strategist; NDX on Tradingview
Notes: The seven-week decline takes the Nasdaq into a key technical confluence at 11520/768- a region defined by the 100% extension of the yearly decline and the 50% retracement of the 2020 advance. Looking for possible price inflection here with a break / weekly close below needed to keep the immediate decline viable towards the 61.8% retracement at 10589. Initial resistance now at the 2021 low-week close (12668) with bearish invalidation now lowered to the April high-week close / upper parallel at 13860.
Bottom line: Nasdaq is testing confluent downtrend support for the second consecutive week. From a trading standpoint, a good zone to reduce portions of short-exposure / lower protective stops- rallies should be capped by 13000 IF price is heading lower on this stretch with a break from here keeping the focus on Fibonacci support at 10589.
Dow Jones Industrial Average Price Chart – US30 Weekly
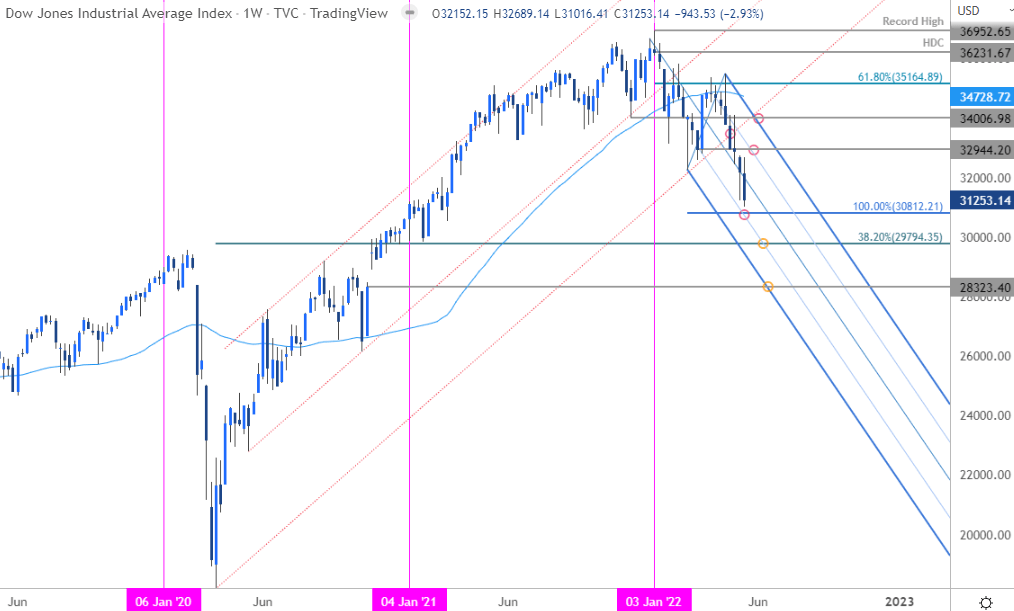
Chart Prepared by Michael Boutros, Technical Strategist; US30 on Tradingview
Notes: The Dow may be playing catch-up here with the index down more than 16% off the record highs. The decline is approaching confluent downtrend support at the 100% extension near 30812- looking for a reaction in price there IF reached with a break / weekly close below needed to keep the short-bias viable towards the 38.2% retracement / 2021 lows at 29794/856. Initial resistance now at the 75% parallel / March close-lows at 32944 with bearish invalidation lowered to the December low at 34006.
Bottom Line: We’re looking for a reaction on a drop into downtrend support at 30812 for guidance here. From a trading standpoint, look to reduce short-exposure on stretch towards confluent support- rallies should be capped by 32944 IF price is heading lower with a break below the keeping the focus on 29794.
For a complete breakdown of Michael’s trading strategy, review his Foundations of Technical Analysis series on Building a Trading Strategy
Active Weekly Technical Setups
- New Zealand Dollar (NZD/USD)
- Gold (XAU/USD)
- Crude Oil (WTI)
- Canadian Dollar (USD/CAD)
- British Pound (GBP/USD)
- Australian Dollar (AUD/USD)
- US Dollar Index (DXY)
- Euro (EUR/USD)
-Written by Michael Boutros, Technical Strategist with DailyFX
Follow Michael on Twitter @MBForex


