


S&P 500, Nasdaq & Dow Technical Price Outlook: Weekly Trade Levels
- S&P 500, Nasdaq & Dow technical trade level update – Weekly Charts
- SPX500 sell-off approaching key support zone near 4309
- Nasdaq vulnerable while below 14420– Initial support 13301
- Dow advance capped by Fibonacci resistance at 35164 – Initial support 33502
Stocks are on the defensive ahead of the weekly close with all three-major US equity indices trading heavy in early US trade on Friday. Hawkish FOMC rhetoric over the past few days has continued to fuel expectations for higher rates and faster – price discovery is underway. From a technical standpoint, the levels are clear and the threat remains for further losses in the days ahead. These are the targets and invalidation levels that matter on the S&P 500 (SPX500), Nasdaq (NDX) and the Dow Jones Industrial Average (US30) weekly technical price charts. Review my latest Strategy Webinar for an in-depth breakdown of these technical stock setups and much more.
S&P 500 Price Chart – SPX500 Weekly
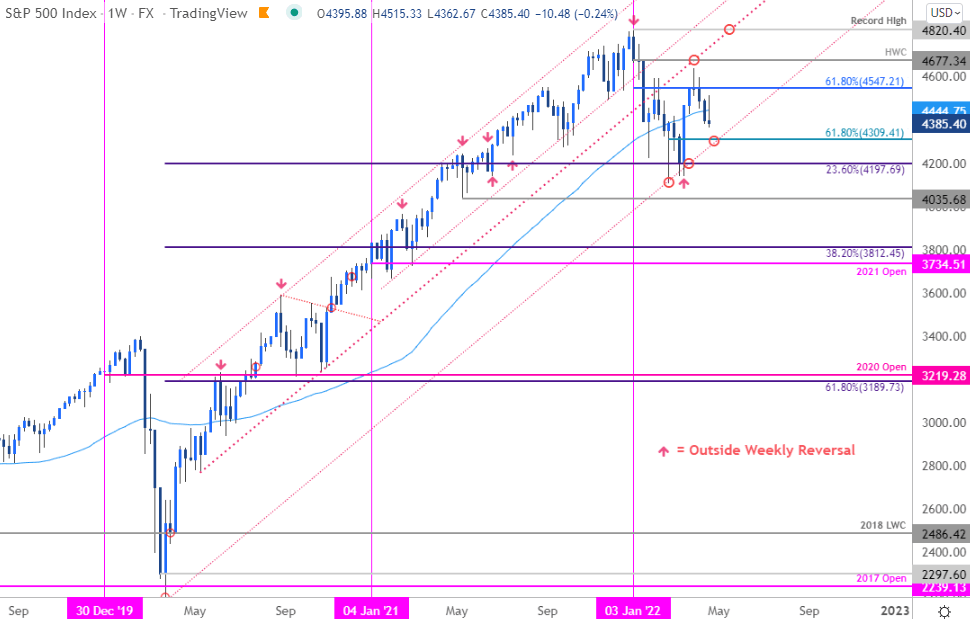
Chart Prepared by Michael Boutros, Technical Strategist; SPX500 on Tradingview
Technical Outlook: In my last S&P500 Technical Outlook we noted that, “The S&P 500 may be vulnerable into the April open after rally a full 13% rally off the yearly lows. While the broader outlook remains constructive, the threat of another test of the lows remains heading into Q2.” The SPX500 is now down more than 3.6% month-to-date with an outside-day reversal in the index yesterday threatening a retreat back towards trend support.
Key weekly support objectives remain unchanged at the confluence of the 2020 parallel and the 61.8% Fibonacci retracement of the late-February advance at 4309- looking for a larger reaction there IF reached. A break below this threshold would be extremely damaging from a technical standpoint. Respect price action around this zone and watch the closes- losses beyond could fuel an accelerated test of the 4197 support level. Initial resistance now back at the 52-week moving average near ~4444 backed by the 61.8% retracement of the 2022 range at 4547- a breach / close above this level would be needed to mark resumption of the broader uptrend towards the record high-week close at 4677.

Bottom line: The S&P 500 turned from key technical resistance three weeks ago with the pullback now searching for a test of longer-term, uptrend support. From at trading standpoint, look to reduce portions of short-exposure / lower protective stops on a stretch down into 4309- area of interest for possible price inflection IF reached. I’ll publish an updated S&P 500 Technical Outlook once we get further clarity on the near-term SPX500 technical trade levels. Stay tuned!
S&P 500 Trader Sentiment – SPX500 Price Chart

- A summary of IG Client Sentiment shows traders are net-short the S&P 500- the ratio stands at +1.37 (57.74% of traders are long) – typically a weak bearishreading
- Long positions are5.97% higher than yesterday and 4.33% higher from last week
- Short positions are 9.21% lower than yesterday and 3.50% higher from last week
- We typically take a contrarian view to crowd sentiment, and the fact traders are net-long suggests US 500 prices may continue to fall. Traders are further net-long than yesterday and last week, and the combination of current positioning and recent changes gives us a stronger US 500-bearish contrarian trading bias from a sentiment standpoint.

Nasdaq 100 Price Chart – NDX Weekly
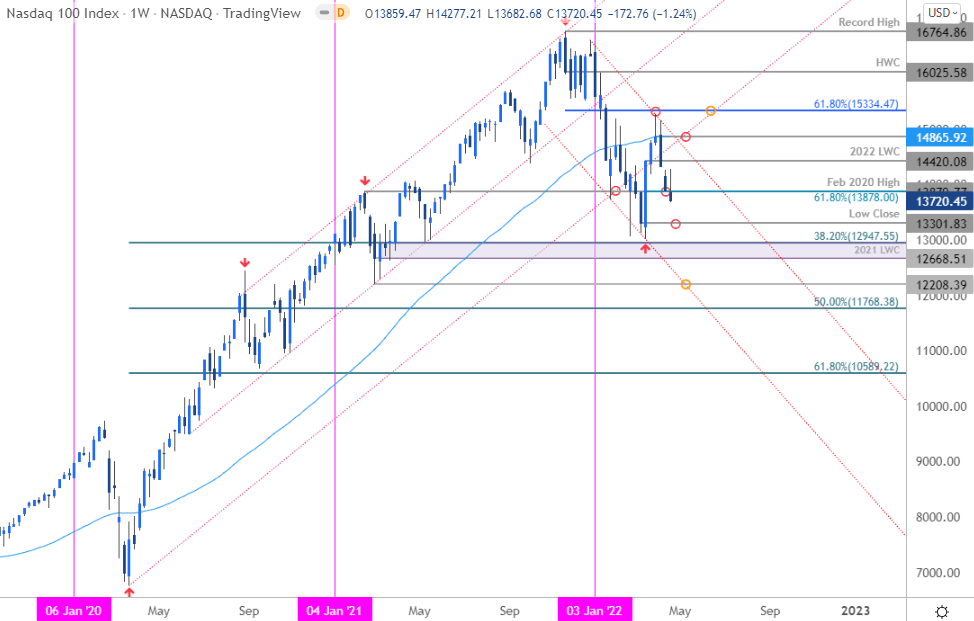
Chart Prepared by Michael Boutros, Technical Strategist; NDX on Tradingview
Notes: Into the start of the month we noted that a rally, “of more than 17% takes the Nasdaq recovery back towards the 52-week moving average (~14863) – risk for topside exhaustion while below 15334. . .” That ended up being the high with a sharp reversal he following week sparking another plunge in the index.
A close below the February 2020 high / 61.8% retracement of the March advance at 13878/79 would leave the risk for further losses towards the yearly close-low at 13301 with key support steady at 2021 low-week close / 38.2% retracement (12668/947). Weekly resistance at yearly low-week close at 14420 with bearish invalidation lowered to the 52-week moving average / the March high-week close at 14861/65.
Bottom line: While the threat remains for further losses here- the technical stance is not as clear. That said, from a trading standpoint, looking for possible price inflection on a stretch towards 13301 for guidance- rallies should be capped by 14420 IF price is heading lower on this stretch.
Dow Jones Industrial Average Price Chart – US30 Weekly
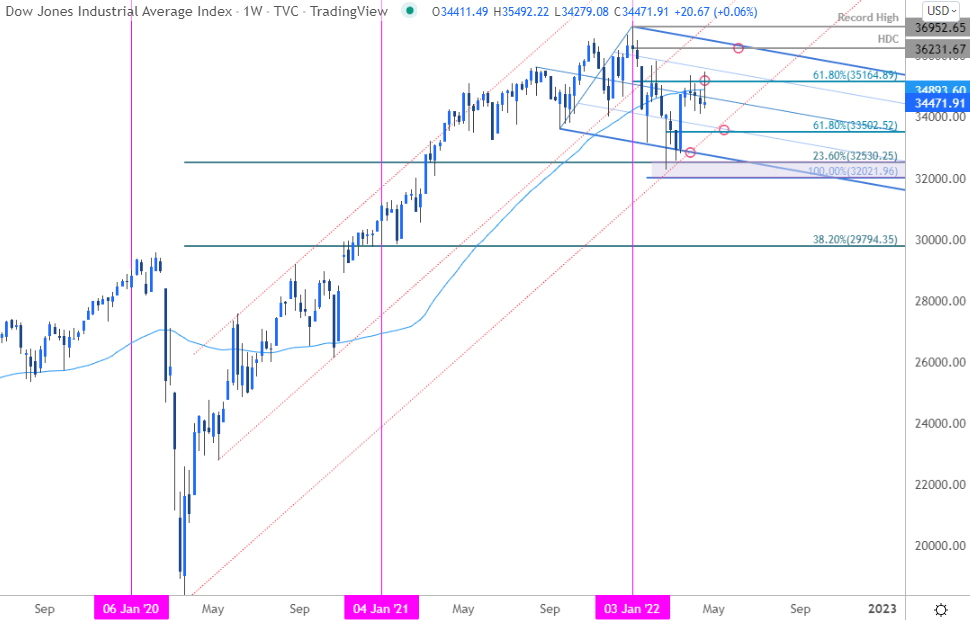
Chart Prepared by Michael Boutros, Technical Strategist; US30 on Tradingview
Notes: Nearly three-weeks later and there’s nothing to update here on the Dow. The index failed a third attempt to breach key resistance at the 61.8% retracement of the yearly range at 35164. Note that price has been unable to mark a weekly close above the 52-week moving average with a contractionary range coiling just below. Weekly support rests at 33502 with a more significant technical confluence just lower at 32021/530. Ultimately a topside breach above 35164 is needed to shift the medium-term focus back towards the yearly high-week close at 36231.
Bottom Line: The Dow is coiling for a move here and while the broader uptrend is preserved, the threat remains for a test of slope support closer to 33500- area of interest for possible price inflection IF reached. From a trading standpoint, looking for a low in the weeks ahead.
For a complete breakdown of Michael’s trading strategy, review his Foundations of Technical Analysis series on Building a Trading Strategy
Active Weekly Technical Setups
- British Pound (GBP/USD)
- US Dollar Index (DXY)
- Gold (XAU/USD)
- Euro (EUR/USD)
- Crude Oil (WTI)
- Canadian Dollar (USD/CAD)
- Australian Dollar (AUD/USD)
-Written by Michael Boutros, Technical Strategist with DailyFX
Follow Michael on Twitter @MBForex


