


Australian Dollar Technical Price Outlook: AUD/USD Weekly Trade Levels
- Australian Dollar technical trade level update - Weekly Chart
- AUD/USD plunges 2% off yearly / weekly high- threatens deeper correction within the uptrend
- Aussie resistance 7531, 7610 (key), 7705- Support 7385/96 (critical), 7235/70
The Australian Dollar plunged more than 2% off the weekly highs with AUD/USD reversing sharply from key technical resistance levels. The reversal threatens a deeper correction in the days ahead and a pullback may offer more favorable opportunities closer to trend support. These are the updated targets and invalidation levels that matter on the AUD/USD weekly price chart. Review my latest Weekly Strategy Webinar for an in-depth breakdown of this Aussie technical setup and more.
Australian Dollar Price Chart – AUD/USD Weekly
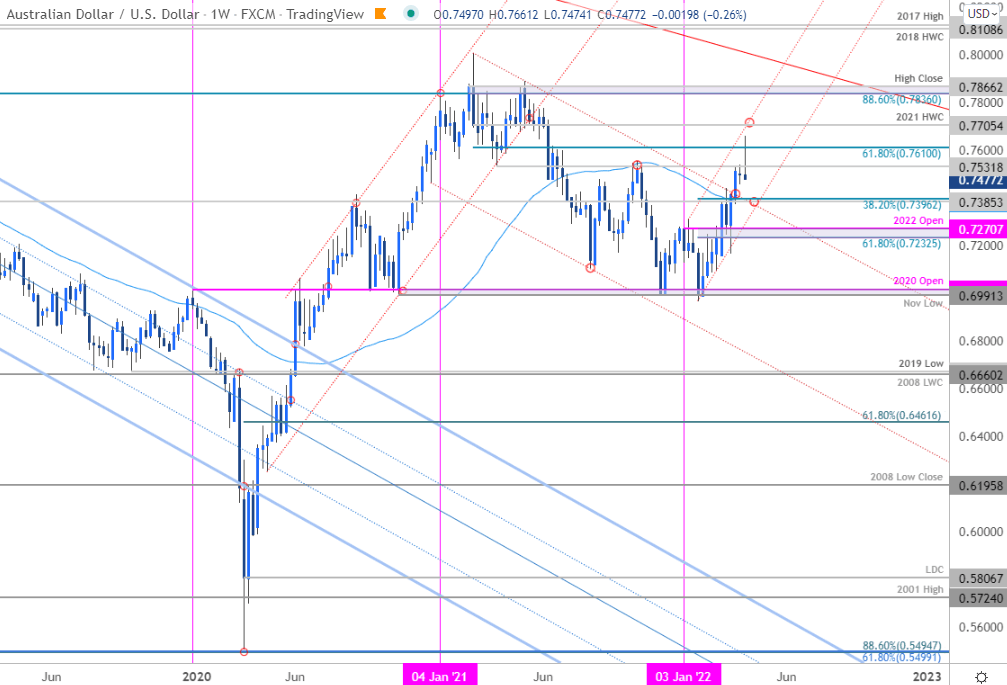
Chart Prepared by Michael Boutros, Technical Strategist; AUD/USD on Tradingview
Notes: In last month’s AUD/USD Technical Forecast we note that, “A six-week recovery in the Australian Dollar has reversed off long-term downtrend resistance. The immediate focus is on this turn lower with an exhaustion-low ahead of 7149 needed to keep the recovery viable.” That recovery was short-lived with price registering a low at 7165 before reversing sharply higher. The advance ripped through resistance targets at 7531 and the 61.8% Fibonacci retracement of the 2021 decline (7610) before reversing sharply lower- Is a near-term high in place?
Key support rests at a major technical confluence around 7385/96- a region now defined by the May 2017 low-week close, the 52-week moving average and the 38.2% retracement of the year-to-date range. A break below this threshold would threaten an accelerated decline towards the 61.8% retracement / objective yearly open at 7232/70. Weekly resistance objectives are unchanged at 7531, 7610 and the 2021 high-week close at 7705- look for a larger reaction there IF reached.

Bottom line: The Australian Dollar breakout may be vulnerable to near-term exhaustion here and we’re on the lookout for an exhaustion low closer to trend support. From a trading standpoint, losses should be limited to 7385 for the long-bias to remain viable with a weekly close above 7610 needed to mark resumption of the yearly uptrend. Review my latest Australian Dollar Price Outlook for a closer look at the near-term AUD/USD technical trade levels.
For a complete breakdown of Michael’s trading strategy, review his Foundations of Technical Analysis series on Building a Trading Strategy
Australian Dollar Trader Sentiment – AUD/USD Price Chart
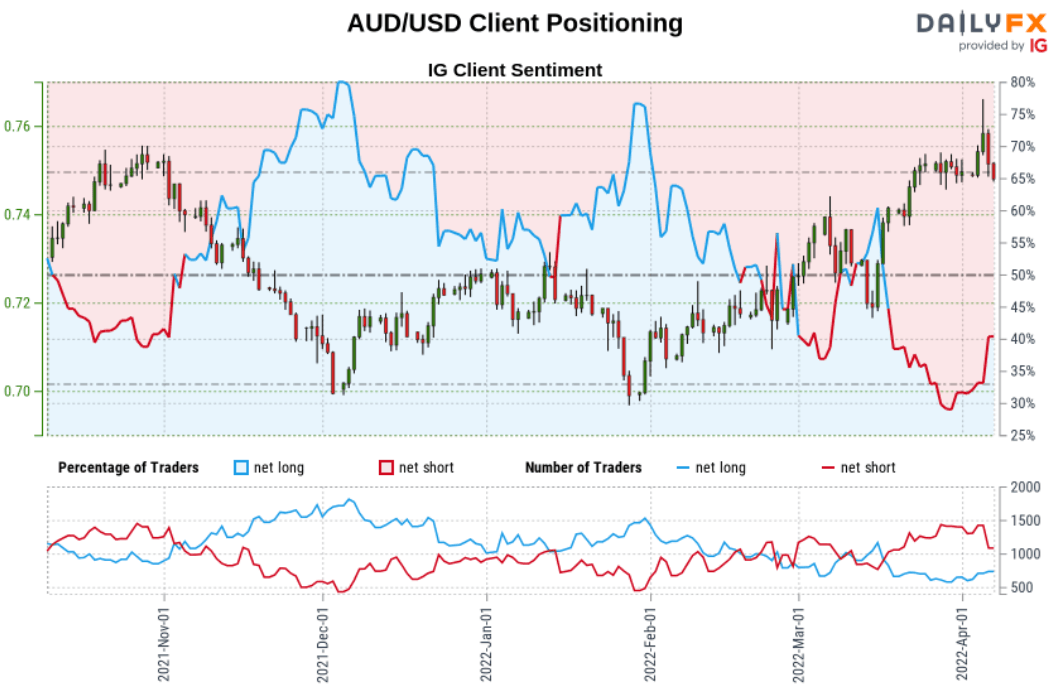
- A summary of IG Client Sentiment shows traders are net-short AUD/USD - the ratio stands at -1.18 (45.79% of traders are long) – typically neutral reading
- Long positions are 16.49% higher than yesterday and 29.44% higher from last week
- Short positions are16.71% lower than yesterday and 23.87% lower from last week
- We typically take a contrarian view to crowd sentiment, and the fact traders are net-short suggests AUD/USD prices may continue to rise. Yet traders are less net-short than yesterday and compared with last week. Recent changes in sentiment warn that the current AUD/USD price trend may soon reverse lower despite the fact traders remain net-short.
| Change in | Longs | Shorts | OI |
| Daily | 2% | 3% | 2% |
| Weekly | 29% | -46% | 0% |
---
Australia / US Economic Calendar

Economic Calendar - latest economic developments and upcoming event risk.
Previous Weekly Technical Charts
- S&P 500, Nasdaq, Dow
- US Dollar Index (DXY)
- Japanese Yen (USD/JPY)
- Gold (XAU/USD)
- Crude Oil (WTI)
- British Pound (GBP/USD)
- Canadian Dollar (USD/CAD)
--- Written by Michael Boutros, Technical Strategist with DailyFX
Follow Michael on Twitter @MBForex


