


Japanese Yen Technical Price Forecast: USD/JPY Weekly Trade Levels
- Japanese Yen technical trade levels update – Weekly Chart
- USD/JPY breakout falters ahead of key resistance at seven-year highs
- Support 120.66, 118.66, 117.90(critical)- Resistance at 125.28/85(key), 129.50-130, 132.24
The US Dollar is poised to snap a three-week winning streak against the Japanese Yen with the USD/JPY breakout faltering just pips ahead of key resistance a multi-year highs. While the broader focus remains constructive, the immediate advance may be vulnerable and we’ll be on the lookout for an exhaustion-low heading into the April open. These are the updated targets and invalidation levels that matter on the USD/JPY weekly price chart ahead of NFPs.Review my latest Weekly Strategy Webinar for an in-depth breakdown of this USD/JPY technical setup and more.
Japanese Yen Price Chart – USD/JPY Weekly
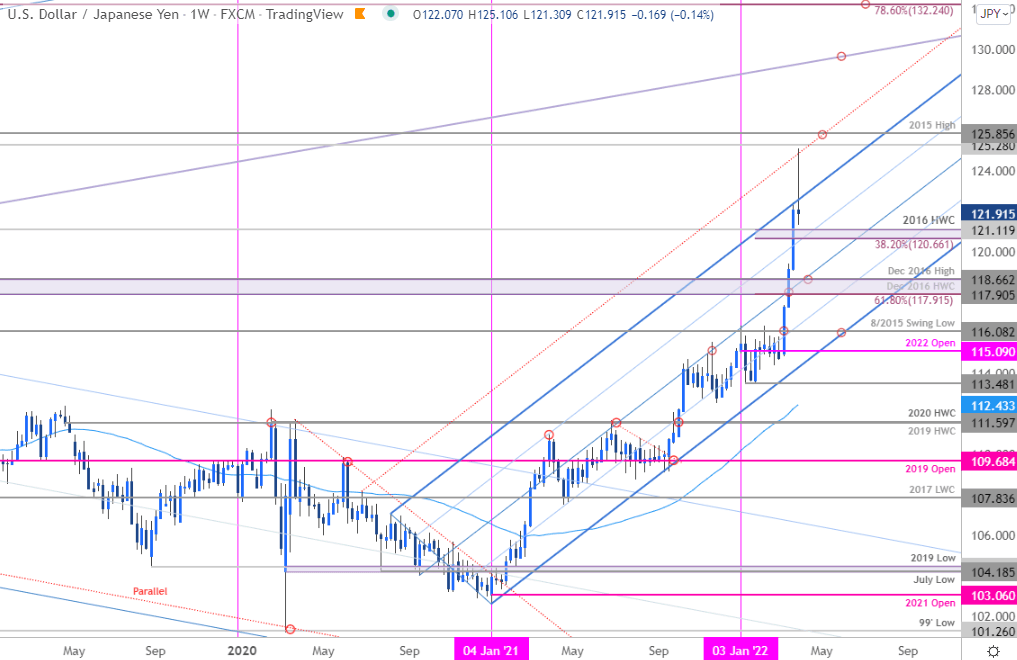
Chart Prepared by Michael Boutros, Technical Strategist; USD/JPY on Tradingview
Notes: In my last Japanese Yen Weekly Price Outlook we highlighted key resistance at, “the August 2015 swing low at 116.08- a breach / weekly close above this threshold is needed to mark resumption of the broader uptrend towards the 2017 high-week close at 116.90 and the December 2016 high-week close at 117.90 (look for a larger reaction there IF reached).” USD/JPY ripped through both these levels in one day with the March 11th breakout charging a rally of more than 9.1% off the monthly lows. The advance failed to mark a weekly close above the upper median-line parallel (blue) with USD/JPY marking an intra-week high just pips from key resistance zone 125.28/85- a region defined by the 2015 swing highs. Is a near-term exhaustion high in place?
Initial weekly support now rests at the 38.2% retracement of the year-to-date range / 2016 high-week close at 120.66-121.11 backed a more significant technical confluence at 117.91-118.66- a region defined by the 61.8 Fibonacci retracement the December 2016 high-week close / high at. Look for a low ahead of this threshold IF USD/JPY is indeed heading higher on this stretch. A topside breach of this formation would likely fuel another accelerated advance towards susbequent resistance objectives near the highlighted slope region around ~129.50-130 and the 78.6% retracement of the 1998 decline at 132.24.

For a complete breakdown of Michael’s trading strategy, review his Foundations of Technical Analysis series on Building a Trading Strategy
Bottom line:The USD/JPY breakout is extending into key resistance at multi-year highs and while the broader outlook remains constructive, the immediate advance may be vulnerable in the weeks ahead. From a trading standpoint, a good zone to reduce portions of long-exposure / raise protective stops – losses should be limited to 117.91 on pullbacks with a breach / weekly close above 125.85 needed to fuel the next leg higher in price. Stay nimble heading into the April open with US non-farm payrolls on tap Friday – buckle-up! I’ll publish an updated Japanese Yen Price Outlook once we get further clarity on the near-term USD/JPY technical trade levels.
Japanese Yen Trader Sentiment – USD/JPY Price Chart
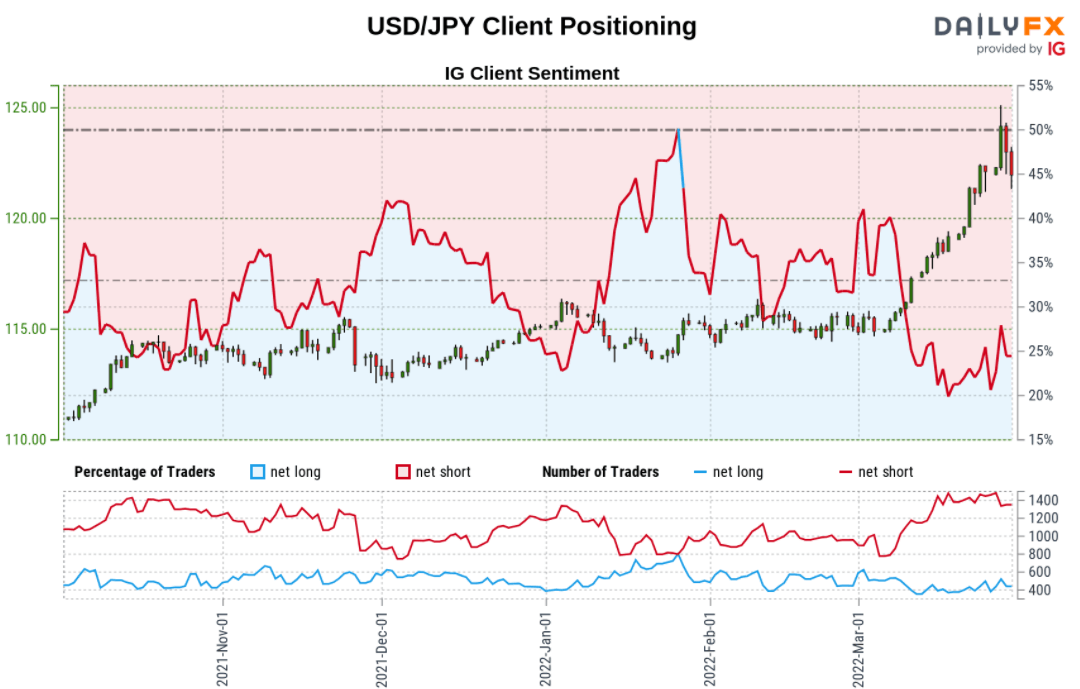
- A summary of IG Client Sentiment shows traders are net-short USD/JPY - the ratio stands at -3.02 (24.90% of traders are long) – typically bullish reading
- Long positions are15.38% higher than yesterday and 9.49% higher from last week
- Short positions are1.72% higher than yesterday and 3.76% lower from last week
- We typically take a contrarian view to crowd sentiment, and the fact traders are net-short suggests USD/JPY prices may continue to rise. Yet traders are less net-short than yesterday and compared with last week. Recent changes in sentiment warn that the current USD/JPY price trend may soon reverse lower despite the fact traders remain net-short.
| Change in | Longs | Shorts | OI |
| Daily | -16% | 0% | -2% |
| Weekly | -2% | 5% | 4% |
---
US / Japan Economic Calendar
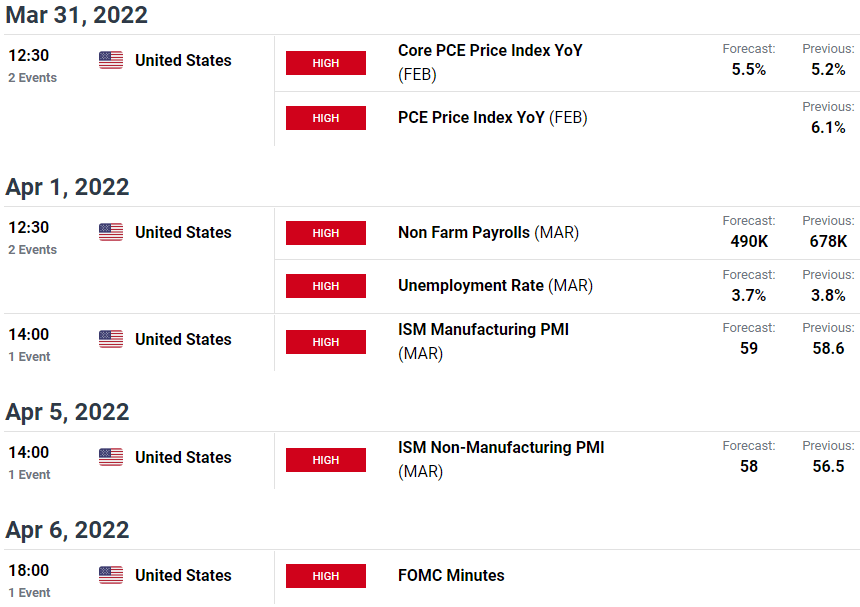
Economic Calendar - latest economic developments and upcoming event risk.
Previous Weekly Technical Charts
- Gold (XAU/USD)
- Australian Dollar (AUD/USD)
- Crude Oil (WTI)
- British Pound (GBP/USD)
- Canadian Dollar (USD/CAD)
- S&P 500, Nasdaq, Dow
- US Dollar Index (DXY)

--- Written by Michael Boutros, Technical Strategist with DailyFX
Follow Michael on Twitter @MBForex


