


US Dollar Technical Price Outlook: DXY Weekly Trade Levels
- US Dollar Technical trade level update – Weekly Chart
- USD rally surges into key uptrend resistance- Russian aggression / NFPs to drive
- DXYsupport 95.67, 95.15 (bullish invalidation) – Resistance 97.70 (critical), 98.30
The US Dollar Index surged more than 1.1% this week with as the escalating situation in Ukraine raises the probability of a larger conflict between Russia and the West. A bout of risk aversion has continued to support the greenback with DXY now approaching critical uptrend resistance- risk for near-term price inflection here. These are the updated technical targets and invalidation levels that matter on the US Dollar Index weekly price chart. Review my latest Strategy Webinar for an in-depth breakdown of thisDXY technical setup and more.
US Dollar Index Price Chart – DXY Weekly

Chart Prepared by Michael Boutros, Technical Strategist; US Dollar Index on Tradingview
Notes: In my January US Dollar Weekly Price Outlook we noted that, “the focus is on a breakout of the monthly range for guidance with the broader outlook constructive while above 94.47.” DXY registered a low at the October 2017 high at 95.15 in the following weeks with the dollar surging higher this month amid a flow of risk aversion on the deteriorating war in Ukraine. The advance now takes the Dollar into a critical technical resistance confluence at 91.69/72- a region defined by the 2018 swing high and the 61.8% Fibonacci retracement of the 2020 decline. A breach / close above this threshold is needed to keep the immediate long-bias viable.
Initial weekly support rests with the 2021 high-week close at 96.67 backed by the objective yearly open at 95.67. Broader bullish invalidation now raised to 95.05. A topside breach above this key barrier keeps the focus on subsequent resistance objectives at 98.30 and the 2019 high-week close at 98.84- look for a larger reaction there IF reached.
For a complete breakdown of Michael’s trading strategy, review his Foundations of Technical Analysis series on Building a Trading Strategy
Bottom line: The US Dollar rally is now approaching a critical technical barrier at uptrend resistance- threat for near-term exhaustion here. From a trading standpoint, a good zone to reduce portions of long-exposure / raise protective stops – losses should be limited to the 96.67 IF price is heading higher on this stretch with close above 97.72 needed to mark resumption of the broader uptrend in the Dollar. US non-farm payrolls (NFP) on tap Friday. Review my latest US Dollar Price Outlook for a closer look at the near-term DXY technical trade levels.

Key US Data Releases
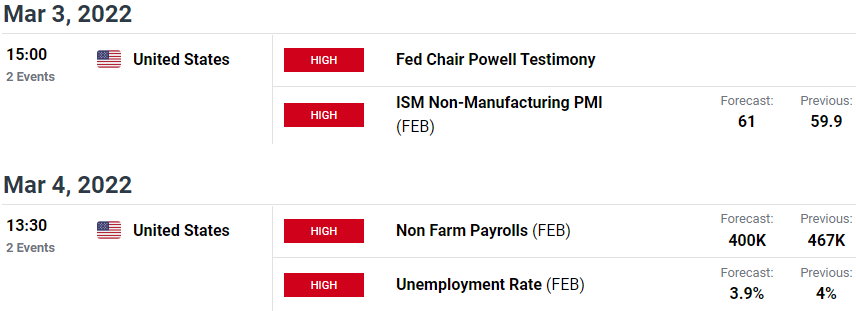
Economic Calendar - latest economic developments and upcoming event risk.
Previous Weekly Technical Charts
- Gold (XAU/USD)
- S&P 500, Nasdaq, Dow
- Australian Dollar (AUD/USD)
- Crude Oil (WTI)
- Japanese Yen (USD/JPY)
- Canadian Dollar (USD/CAD)
- British Pound (GBP/USD)
--- Written by Michael Boutros, Technical Strategist with DailyFX
Follow Michael on Twitter @MBForex


