


S&P 500 Technical Price Outlook: Near-term Trade Levels
- S&P 500, Nasdaq & Dow technical trade level update – Weekly Charts
- SPX500 rebounds off trend support – resistance 4393
- Nasdaq breakdown reverses sharply off key support around 13K- resistance 14763
- Dow sell-off defends critical support zone near 32K – resistance at 34767
Stocks remain vulnerable as markets to digest a barrage of war headlines coming out of Europe as the Russian invasion of Ukraine continues to weigh on market sentiment. The S&P, Nasdaq & Dow are down more than 1.64%, 0.81% and 1.5% respectively in early US trade on Friday with the indices trading just above support near the yearly lows. These are the targets and invalidation levels that matter on the SPX500, NDX and US30 technical price charts in the week ahead. Review my latest Strategy Webinar for an in-depth breakdown of these technical stock setups and much more.
S&P 500 Price Chart – SPX500 Weekly

Chart Prepared by Michael Boutros, Technical Strategist; SPX500 on Tradingview
Technical Outlook: In my last S&P500 Technical Outlook we noted that SPX500 was, “attempting to break below key support into the close of the week at 4364/72- a region defined by the 61.8% Fibonacci retracement of the late-January recovery and the 52-week moving average.Weakness beyond this level threatens a new yearly low for the index with initial support seen at the 23.6% retracement of the entire 2019 rally at 4197- look for a larger reaction there IF reached.” SPX plunged lower the following week with the index briefly registering a low at 4104 before reversing sharply off a sliding parallel extending off the 2019 lows.
The rebound failed this week back a the 52-week moving average, putting initial resistance at 4392- a breach / close above this threshold is needed to shift the near-term focus higher towards the 61.8% Fibonacci retracement of 2022 range at 4547. Broader bearish invalidation steady at the yearly high-week close at 4677. Weekly support unchanged at 4197 backed by the 2019 trendline- a break / close below this slope would threaten another bout of accelerated losses towards key support at the May lows/ 100% extension of the yearly decline at 3993-4035.

Bottom line: The S&P 500 pullback remains within the bounds of the broader uptrend and we’re looking to validate the low on a another test of slope support. From at trading standpoint, look for a reaction into slope support for guidance IF reached - ultimately a close below this trend would break a multi-year uptrend in the index- stay nimble here.
S&P 500 Trader Sentiment – US500 Price Chart

- A summary of IG Client Sentiment shows traders are net-long the S&P 500- the ratio stands at +1.27 (55.86% of traders are long) – typically weak bearishreading
- Long positions are1.51% lower than yesterday and 4.51% lower from last week
- Short positions are 8.31% lower than yesterday and 1.27% higher from last week
- We typically take a contrarian view to crowd sentiment, and the fact traders are net-long suggests US 500 prices may continue to fall. Traders are more net-long than yesterday but less net-long from last week. The combination of current positioning and recent changes gives us a further mixed US 500 trading bias from a sentiment standpoint.

Nasdaq 100 Price Chart – NDX Weekly
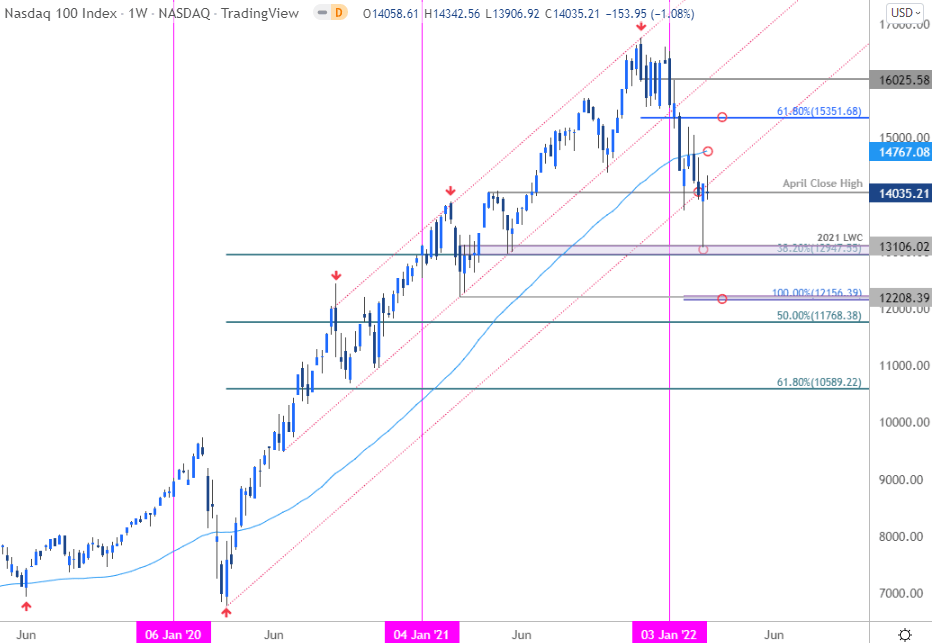
Chart Prepared by Michael Boutros, Technical Strategist; NDX on Tradingview
Notes: Our focus into the close of February was on a reaction here at the April high close / 2020 uptrend support at 14041. We noted that, “Weakness beyond this threshold could be terminal for the 2020 uptrend and fuel another accelerated decline towards the 38.2% retracement of the 2020 advance at 12947.” A break below this threshold saw Nasdaq plunge more than 6% before rebounding off key support at the 2021 low-week close / 38.2% retracement at 12947-13106.
Initial resistance steady at 14041 with a breach above the 52-week moving average (currently ~14761) needed to suggest a more significant low is in place. A break below this key support barrier would threaten a steeper setback towards the 100% extension / 2021 long low at 12156/208- look for a larger reaction there IF reached.
Bottom line: The Nasdaq sell-off has already rebounded off technical support with price failing this week at resistance. From a trading standpoint, expect sideways to lower price action – ultimately we need to resolve a weekly close of this massive range between 12947 – 14041 for guidance.
Dow Jones Industrial Average Price Chart – US30 Weekly
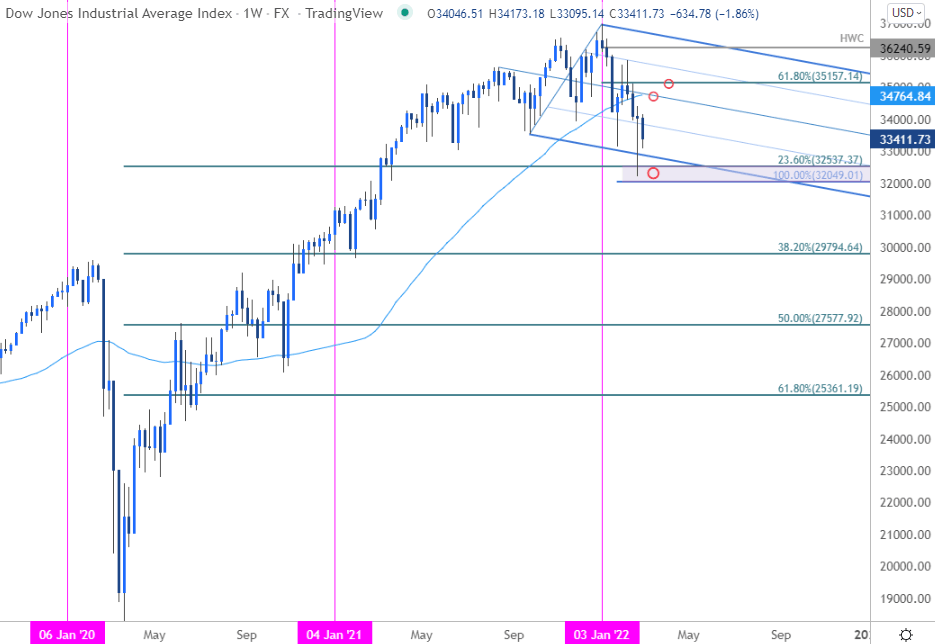
Chart Prepared by Michael Boutros, Technical Strategist; US30 on Tradingview
Notes: The Dow has remained rather resilient in the face of the recent risk sell-off and the proposed downtrend we highlighted last month remains a viable slope for this decline. Last-week’s plunge dropped into key support at the 100% extension / 23.6% retracement at 32049/537before rebounding sharply. So was that the low? Expect some noise here as price consolidates above the this key zone with resistance eyed at the 52-week moving average / median-line near 34767. A close above the 61.58% retracement at 35157 would be needed to suggest a more significant low is in place.
Bottom Line: The Dow has rebounded sharply off downtrend support. From a trading standpoint, look for a signs of downside exhaustion with a rally through the median-line needed to shift the focus higher again. Losses below 32049 would be extremely damaging from a technical standpoint with such a scenario threatening g a decline towards the 38.2% retracement at 29794. Once again, stay tuned here.
For a complete breakdown of Michael’s trading strategy, review his Foundations of Technical Analysis series on Building a Trading Strategy
Active Technical Setups
- US Dollar Index (DXY)
- Gold (XAU/USD)
- Australian Dollar (AUD/USD)
- Crude Oil (WTI)
- Japanese Yen (USD/JPY)
- Canadian Dollar (USD/CAD)
- British Pound (GBP/USD)
-Written by Michael Boutros, Technical Strategist with DailyFX
Follow Michaelon Twitter @MBForex


