


S&P 500 Technical Price Outlook: Near-term Trade Levels
- S&P 500, Nasdaq & Dow technical trade level update – Weekly Charts
- SPX500 down more than 10% off record high- break of support exposes 4197
- Nasdaq plummets nearly 16% off record high- break lower exposes 12947
- Dow down more than 8% off record high- side-ways to lower sub-35512
Stocks plunged this week with the S&P, Nasdaq & Dow down more than 2.1%, 2.3% and 2.2% respectively. The sell-off has taken the indices through critical support levels with the threat of further losses into the final full-week of February trade. Is a larger correction underway? These are the targets and invalidation levels that matter on the SPX500, NDX and US30 technical price charts in the week ahead. Review my latest Strategy Webinar for an in-depth breakdown of this S&P 500 setup and more.
S&P 500 Price Chart – SPX500 Weekly
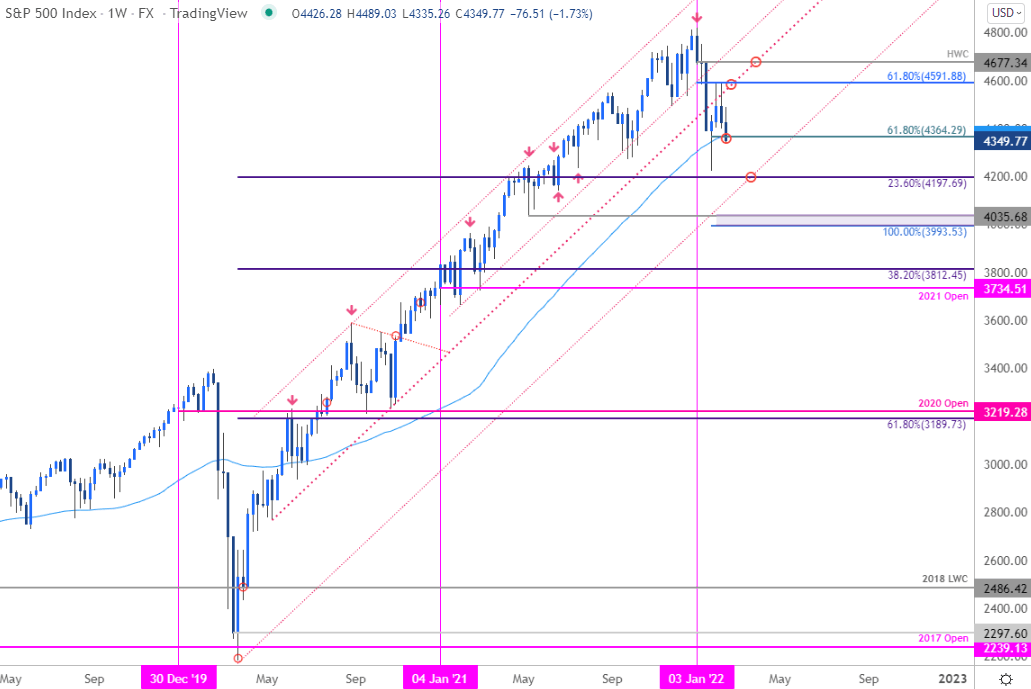
Chart Prepared by Michael Boutros, Technical Strategist; SPX500 on Tradingview
Technical Outlook: In my last S&P500 Technical Outlook we noted that SPX had rebounded off downtrend support and that, “a breach / close above the upper parallel / 61.8% Fibonacci retracement of the yearly range at 4592 would be needed to suggest a more significant low is place / validate a larger reversal.” The recovery failed two-consecutive weekly attempts to breach this threshold with SPX attempting to break below key support into the close of the week at 4364/72- a region defined by the 61.8% Fibonacci retracement of the late-January recovery and the 52-week moving average.
Weakness beyond this level threatens a new yearly low for the index with initial support seen at the 23.6% retracement of the entire 2019 rally at 4197- look for a larger reaction there IF reached. Monthly open resistance stands at 4500 backed by 4592- Ultimately a breach / weekly close back above the 2020 median-line (dotted red line) / record high-week close at 4677 would be needed to put the bulls firmly back in control.

Bottom line: The S&P 500 sell-off is testing a pivotal support zone and threatens a larger decline within the broader 2020 uptrend in the weeks ahead. From a trading standpoint, a good area to lower protective stops – rallies should be capped by the monthly open at 4500 IF price is heading lower on this stretch.
S&P 500 Trader Sentiment – US500 Price Chart

- A summary of IG Client Sentiment shows traders are net-long the S&P 500- the ratio stands at +1.45 (59.20% of traders are long) – typically weak bearishreading
- Long positions are6.26% higher than yesterday and 5.33% higher from last week
- Short positions are 2.10% lower than yesterday and 0.79% higher from last week
- We typically take a contrarian view to crowd sentiment, and the fact traders are net-long suggests US 500 prices may continue to fall. Traders are further net-long than yesterday and last week, and the combination of current positioning and recent changes gives us a stronger US 500-bearish contrarian trading bias from a sentiment standpoint.

Nasdaq 100 Price Chart – NDX Weekly
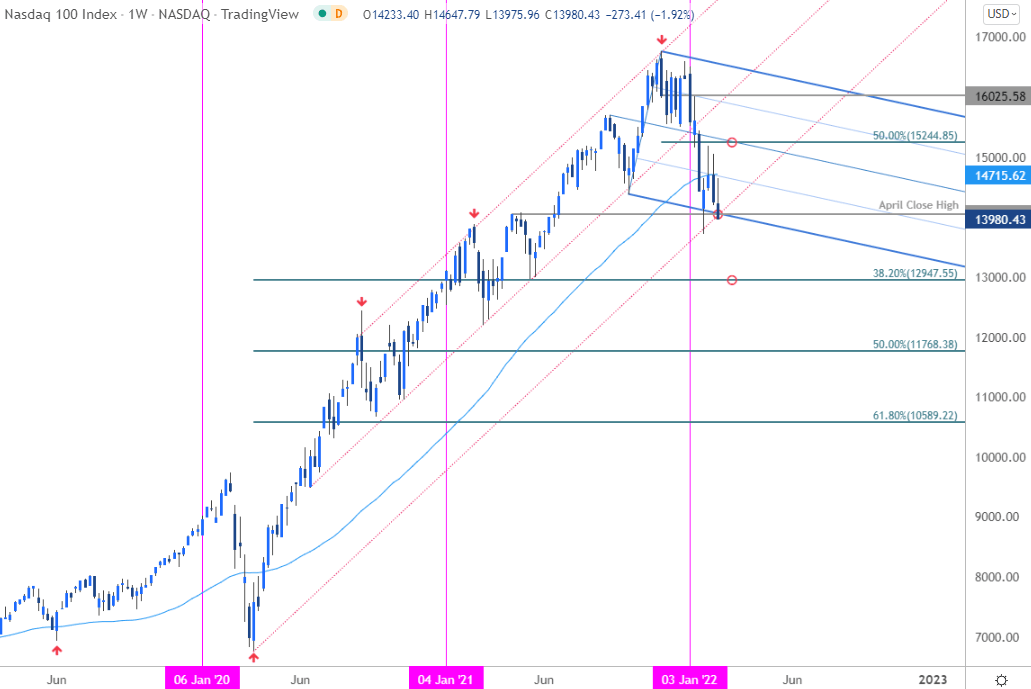
Chart Prepared by Michael Boutros, Technical Strategist; NDX on Tradingview
Notes: A similar stance here with Nasdaq testing a break below confluent support at the April weekly high-close at 14041. Weakness beyond this threshold could be terminal for the 2020 uptrend and fuel another accelerated decline towards the 38.2% retracement of the 2020 advance at 12947. Watch this one into the open next week. Initial resistance eyed at the 25% parallel / 52-week moving average around ~14715 with near-term bearish invalidation not lowered to the median-line / 50% retracement at 15245.
Bottom line: The Nasdaq sell-off is trading into confluent uptrend support with the decline nearing bear-market territory once again. From a trading standpoint a good zone to reduce short-exposure / lower protective stops – look for a reaction here. Rallies should be capped by the monthly open at 14966 IF the index is indeed heading lower on this stretch.
Dow Jones Industrial Average Price Chart – US30 Weekly

Chart Prepared by Michael Boutros, Technical Strategist; US30 on Tradingview
Notes: The Dow technicals looks clear as mud and although the index has fared much better than its counterparts (down only 8% off the highs) the technical clarity is lacking. There’s not enough evidence to rely on this slope yet but the focus is break below the 52-week moving average with the 25% parallel just lower.
Initial resistance back at the yearly moving average near ~34668 backed by the 61.8% retracement at 35512. Broader bearish invalidation steady with the record high-week close at 36240. A break of the January lows here would threaten a plunge towards the lower parallel which converges on the 100% extension / 23.6% retracement at 32049/537- look for a larger reaction there IF reached.
Bottom Line: The Dow has remained rather resilient comparatively speaking in the face of a larger risk-off environment and while the risk is weighted to the downside, the technical clarity does not merit an aggressive stance here. From a trading standpoint, likely to get more chop here but for now, the threat remains for a deeper plunge while below the median-line. Stay tuned on this one.
For a complete breakdown of Michael’s trading strategy, review his Foundations of Technical Analysis series on Building a Trading Strategy
Active Technical Setups
- Australian Dollar (AUD/USD)
- Crude Oil (WTI)
- Japanese Yen (USD/JPY)
- Canadian Dollar (USD/CAD)
- Gold (XAU/USD)
- British Pound (GBP/USD)
- US Dollar Index (DXY)
- New Zealand Dollar (NZD/USD)
- Euro (EUR/USD)
-Written by Michael Boutros, Currency Strategist with DailyFX
Follow Michaelon Twitter @MBForex


