


S&P 500 Technical Price Outlook: Near-term Trade Levels
- S&P 500 technical trade level update – Daily & Intraday Charts
- SPX500 outside-day reversal slams back into monthly / yearly low- risk for steeper losses
- SPX Resistance 4062, 4117/37 (critical), 4309 - Support 3812, 3734, 3664 (key)
The S&P 500 has plunged 19.9%R off the record highs with an outside-day reversal yesterday marking the larges single-day loss sine June of 2020. The decline is testing the monthly / yearly lows again today and while the immediate decline may be nearing exhaustion, the broader threat remains for further losses in the weeks ahead. These are the targets and invalidation levels that matter on the SPX500 technical price charts this week. Review my latest Strategy Webinar for an in-depth breakdown of this SPX500 setup and more.
S&P 500 Price Chart – SPX500 Daily
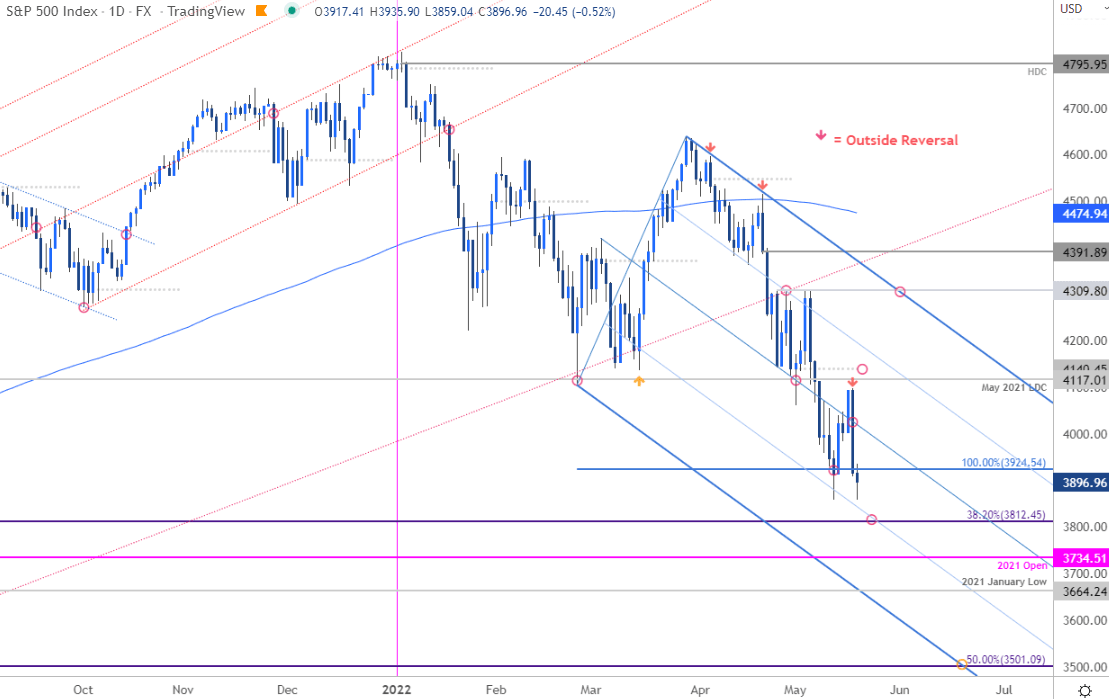
Chart Prepared by Michael Boutros, Technical Strategist; SPX500 on Tradingview
Technical Outlook: In my last S&P 500 technical outlook we warned that the, “S&P 500 remains at risk for further losses on a break of downtrend support here. From a trading standpoint, rallies should be capped by 4309 IF price is heading lower on this stretch with a close below the median-line keeping the focus on 3924.” The index broke lower the following day with price taking out the 3924 support target before rebounding more than 6%- a two-day sell-off has erased the entire advance with price now back at the lows near 3860.
S&P 500 Price Chart – SPX500 240min
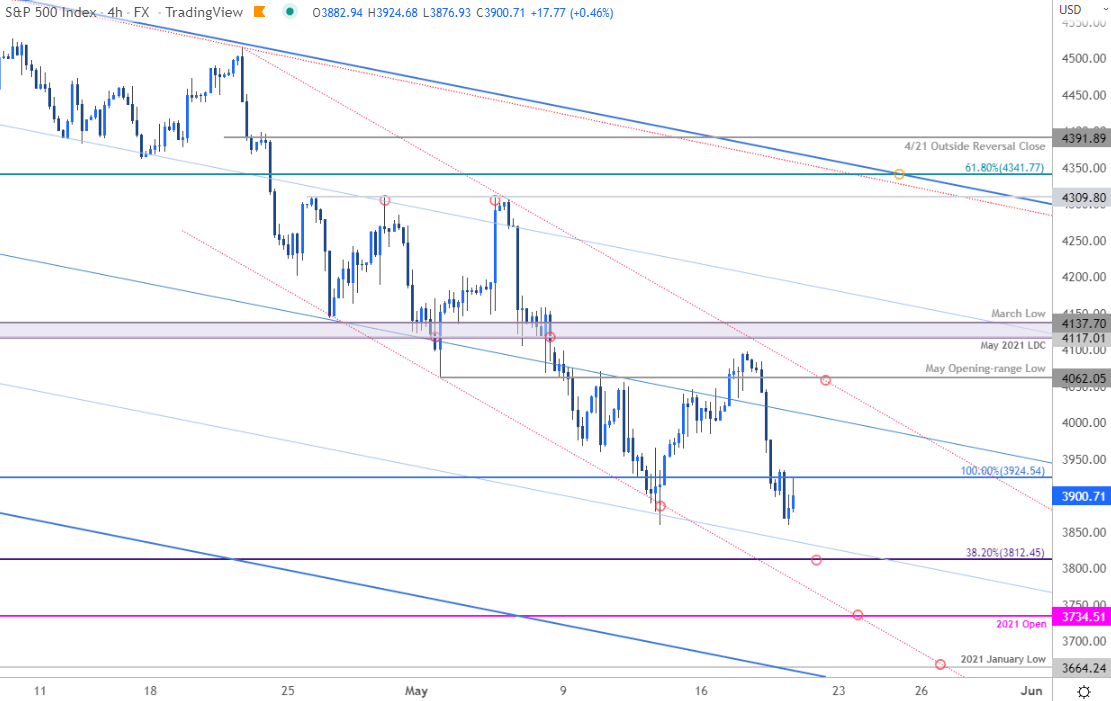
Chart Prepared by Michael Boutros, Technical Strategist; SPX500 on Tradingview
Notes: A closer look at SPX500 price action shows the index trading within the confines of an embedded descending channel formation. Initial resistance now eyed at the median-line (currently ~4000) backed by the May opening-range lows at 4062.Near-term bearish invalidation now lowered to the May 2021 low-day close / March low at 4117/37. A break lower from here would expose subsequent support objectives at the 38.2% Fibonacci retracement of the 2020 advance at 3812, the 2021 yearly open at 3734 and the 2021 low at 3664.

Bottom line: The S&P 500 remains vulnerable to further losses but we’re on the lookout for possible downside exhaustion into the lower parallels in the days ahead. From a trading standpoint, rallies should be capped by 4062 IF the index is heading lower on this stretch with a break lower from here keeping the focus objectives into the 2021 lows. Expect volatility here and stay nimble into the close of the week - be on the lookout for a near-term washout on a move lower- stay tuned! I’ll publish and updated S&P 500 Weekly Technical Forecast once we get further clarity on the longer-term SPX 500 technical trade levels.
For a complete breakdown of Michael’s trading strategy, review his Foundations of Technical Analysis series on Building a Trading Strategy
S&P 500 Trader Sentiment – US500 Price Chart
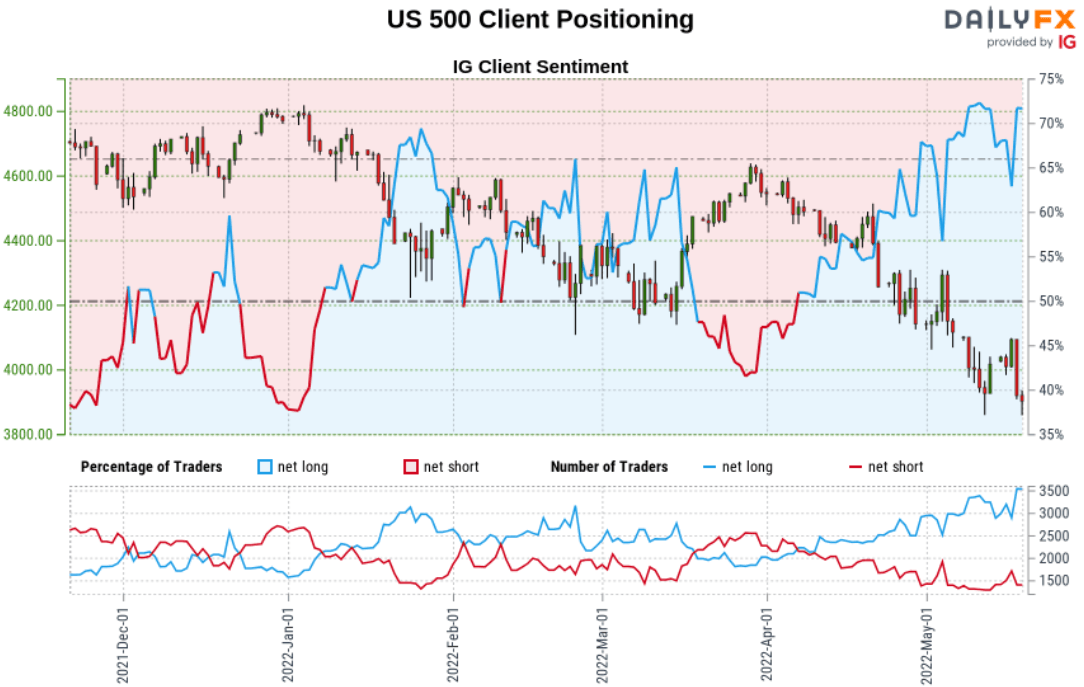
- A summary of IG Client Sentiment shows traders are net-long the S&P 500- the ratio stands at +2.31 (69.75% of traders are long) – typically a bearishreading
- Long positions are14.16% higher than yesterday and 3.99% higher from last week
- Short positions are 14.36% lower than yesterday and 8.30% higher from last week
- We typically take a contrarian view to crowd sentiment, and the fact traders are net-long suggests US 500 prices may continue to fall. Traders are more net-long than yesterday but less net-long from last week. The combination of current positioning and recent changes gives us a further mixed S&P 500 trading bias from a sentiment standpoint.

Active Technical Setups
- Canadian Dollar Technical Outlook: USD/CAD Backs into Uptrend Support
- Gold Price Technical Outlook: Gold Bear Market Bounce? XAU/USD Levels
- EUR/USD Technical Price Outlook: Euro May Crunch- Breakout Imminent
- Australian Dollar Technical Outlook: Aussie Recovery to be Short-Lived
-Written by Michael Boutros, Technical Strategist with DailyFX
Follow Michael on Twitter @MBForex


