


S&P 500, Nasdaq & Dow Technical Price Forecast: Weekly Trade Levels
- S&P 500, Nasdaq & Dow technical trade level update – Weekly Charts
- SPX500 support 3734, 3665, 3482-3501- resistance 3906/08, 4139/96
- Nasdaq testing slope support now, next 10589- resistance 11520/768, 12668
- Dow attempting break of support at 30812, next 29794- resistance 31392, 32944
Stocks have collapsed with all three major equity indices at fresh yearly lows ahead of today’s FOMC interest rate decision. Despite the headlines, the decline has been orderly from a technical standpoint and the focus is on possible inflection as the S&P 500, Nasdaq and Dow approach key pivot zones in price. These are the targets and invalidation levels that matter on the S&P 500 (SPX500), Nasdaq (NDX) and the Dow Jones Industrial Average (US30) weekly technical price charts heading into the Fed and the close of the week. Review my latest Strategy Webinar for an in-depth breakdown of these technical stock setups and much more.
S&P 500 Price Chart – SPX500 Weekly

Chart Prepared by Michael Boutros, Technical Strategist; SPX500 on Tradingview
Technical Outlook: In last month’s S&P500 Weekly Technical Outlook we highlighted the threat for a near-term recovery in SPX500 with, “initial weekly resistance eyed at the June low / 38.2% retracement of the yearly decline at 4139/96 backed by the 61.8% retracement of the March sell-off at 4323 – both levels of interest for possible topside exhaustion IF reached.” Price registered a high at 4204 into the close of May before reversing sharply lower towards weekly support objectives noted at, “the low-week close at 3906backed by3812 and the 2021 yearly open at 3734- look for a larger reaction in price there IF reached.” The index is testing this key level today ahead of the FOMC interest rate decision- buckle up!
The 2021 yearly low rests just lower at 3665- a break / weekly close below this threshold could fuel another accelerated sell-off in the index with such a scenario exposing subsequent support objectives at the 1.618% extension / 50% retracement at 3482-3501 and the August 2019 high-week close at 3419. Initial weekly resistance now stands with a pair of key weekly closes at 3906/08 – a close above this region would leave room for a bit more recovery before resumption lower. Broader bearish invalidation no lowered to yearly channel resistance, currently near ~4260s.

Bottom line: The S&P 500 is testing a key support confluence ahead of today’s Fed rate decision. From a trading standpoint, a good zone to reduce portions of short-exposure / lower protective stops – rallies should be capped by 3906 IF price is heading lower on this stretch with a close below 3665 needed to clear the way for the next leg lower in price. Ultimately, a larger recovery off these levels may offer more favorable opportunities closer to downtrend resistance- stay nimble here and watch the weekly close. I’ll publish and updated S&P 500 Near-term Technical Outlook once we get further clarity on the near-term SPX500 technical trade levels.
S&P 500 Trader Sentiment – SPX500 Price Chart

- A summary of IG Client Sentiment shows traders are net-long the S&P 500- the ratio stands at +2.47 (71.18% of traders are long) – typically a bearishreading
- Long positions are4.01% higher than yesterday and 28.44% higher from last week
- Short positions are 14.15% lower than yesterday and 37.64% lower from last week
- We typically take a contrarian view to crowd sentiment, and the fact traders are net-long suggests US 500 prices may continue to fall. Traders are further net-long than yesterday and last week, and the combination of current positioning and recent changes gives us a stronger SPX500 bearish contrarian trading bias from a sentiment standpoint.

Nasdaq 100 Price Chart – NDX Weekly
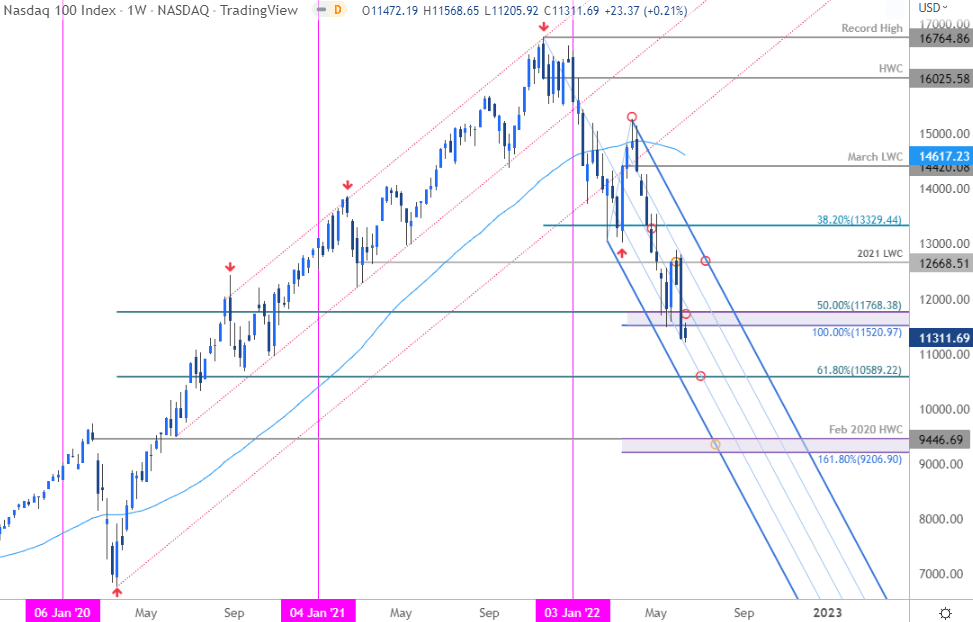
Chart Prepared by Michael Boutros, Technical Strategist; NDX on Tradingview
Notes: Nasdaq broke & closed below confluent support highlighted last month at, “11520/768- a region defined by the 100% extension of the yearly decline and the 50% retracement of the 2020 advance.” The decline has been riding the 25% parallel of the descending pitchfork we’ve been tracking off the 2021 high and IF price is heading lower on this stretch, rallies should now be capped by 11768. That said, previous responses to this slope have produced some recoveries so watch the weekly close here.
A break lower keeps the focus on the 61.8% Fibonacci retracement of the 2021 advance at 10589 backed by the 1.618% extension / February 2020 high-week close at 9206-9446. Broader bearish invalidation now lowered to the 2021 low-week close at 12668.
Bottom line: A break below lateral support takes Nasdaq into downtrend support and we’re looking for possible inflection here. A recovery / close above 11768 would be needed alleviate the immediate downside pressure. Ultimately, the broader focus remains on a drive towards 10589 while within this formation.
Dow Jones Industrial Average Price Chart – US30 Weekly

Chart Prepared by Michael Boutros, Technical Strategist; US30 on Tradingview
Notes: The Dow is testing a break below the 100% extension of the yearly decline at 30812 with the 38.2% retracement of the 2020 rally just lower at 29794- note that this level converges on the 25% parallel and we’re looking for a larger reaction in price there IF reached. Initial resistance now 31392 with broader bearish invalidation lowered to 32944. A break / close below Fibonacci support / 2021 lows would likely fuel another accelerated bout of losses with such a scenario exposing 28323 and the next major confluent support at the 50% retracement / 1.618% ext at 27583/919.
Bottom Line: The immediate focus is on a weekly close below the median-line / 30812 to keep the bears in control towards 29794- area of interest for possible price-inflection IF reached. Ultimately a breach out of this formation would be needed to suggest a more significant near-term exhaustion low is in place.
For a complete breakdown of Michael’s trading strategy, review his Foundations of Technical Analysis series on Building a Trading Strategy
Active Weekly Technical Setups
- Gold (XAU/USD)
- New Zealand Dollar (NZD/USD)
- Crude Oil (WTI)
- Japanese Yen (USD/JPY)
- Euro (EUR/USD)
- Canadian Dollar (USD/CAD)
- Australian Dollar (AUD/USD)
- British Pound (GBP/USD)
- US Dollar Index (DXY)
-Written by Michael Boutros, Technical Strategist with DailyFX
Follow Michael on Twitter @MBForex


