


S&P 500, Nasdaq & Dow Technical Price Outlook: Weekly Trade Levels
- S&P 500, Nasdaq & Dow technical trade level update – Weekly Charts
- SPX500 responds to key support at 3812- resistance 4139/96, 4323
- Nasdaq rebounds off key support at 11520/768- resistance 12668, 13506
- Dow reversal off key support at 30812- resistance 32944
Stocks snapped a seven-week losing streak with all three Major equity indices rebounding sharply off key technical support. The rallies shift the near-term focus towards a larger recovery within the broader downtrend and we’re on the lookout for an exhaustion high in the weeks ahead. These are the targets and invalidation levels that matter on the S&P 500 (SPX500), Nasdaq (NDX) and the Dow Jones Industrial Average (US30) weekly technical price charts heading into the close of the Month. Review my latest Strategy Webinar for an in-depth breakdown of these technical stock setups and much more.
S&P 500 Price Chart – SPX500 Weekly
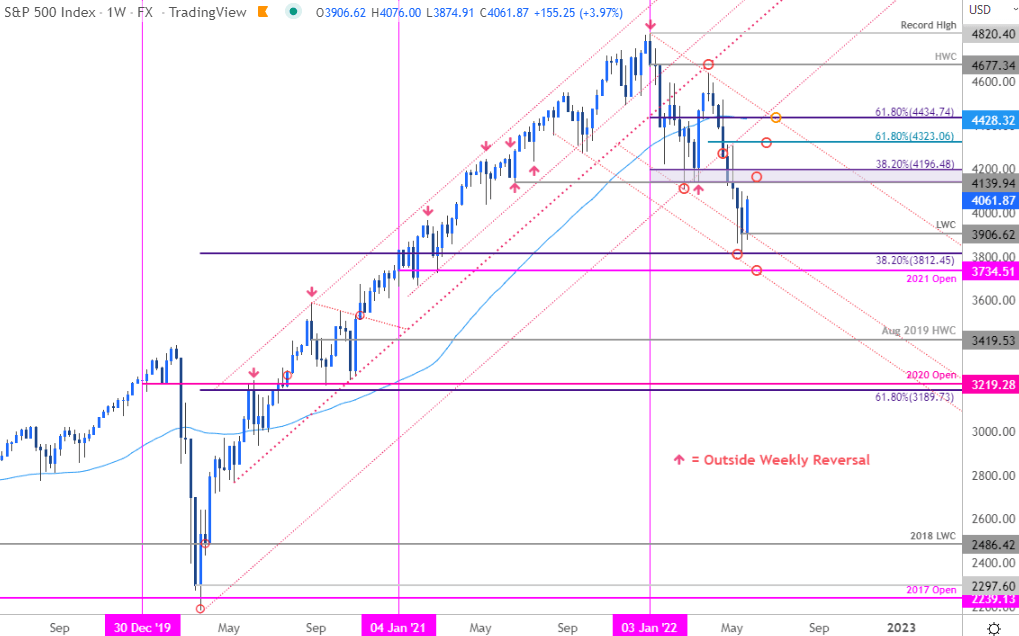
Chart Prepared by Michael Boutros, Technical Strategist; SPX500 on Tradingview
Technical Outlook:In my last S&P500 Weekly Technical Outlook we noted that SPX500 had, “is poised to mark a seventh consecutive weekly decline with price now challenging confluent downtrend support- risk for a bear-market bounce here.” The index rebounded off the 38.2% Fibonacci retracement of the 2019 rally at 3812 (low registered at 3810) into the close last week with the subsequent rebound now up more than 6.7% off the lows.
Threat remains for some further recovery here with initial weekly resistance eyed at the June low / 38.2% retracement of the yearly decline at 4139/96 backed by the 61.8% retracement of the March sell-off at 4323 – both levels of interest for possible topside exhaustion IF reached. Broader bearish invalidation now set to the 52-week moving average / 61.8% retracement of the yearly range at 4428/34 - a breach / close above would be needed to suggest a more significant low was registered last week. Initial weekly support now rests with the low-week close at 3906 backed by 3812 and the 2021 yearly open at 3434 - look for a larger reaction in price there IF reached.

Bottom line: A rebound off downtrend support keeps the focus on this near-term recovery. From at trading standpoint, look for reduce long-exposure / raise protective stops on a stretch towards the 4139-96 pivot zone- rallies should be capped by 4323 IF price is still heading lower on this stretch. Review my latest S&P 500 Near-term Technical Outlook for a closer look at the near-term SPX500 technical trade levels.
S&P 500 Price Chart – SPX500 Weekly
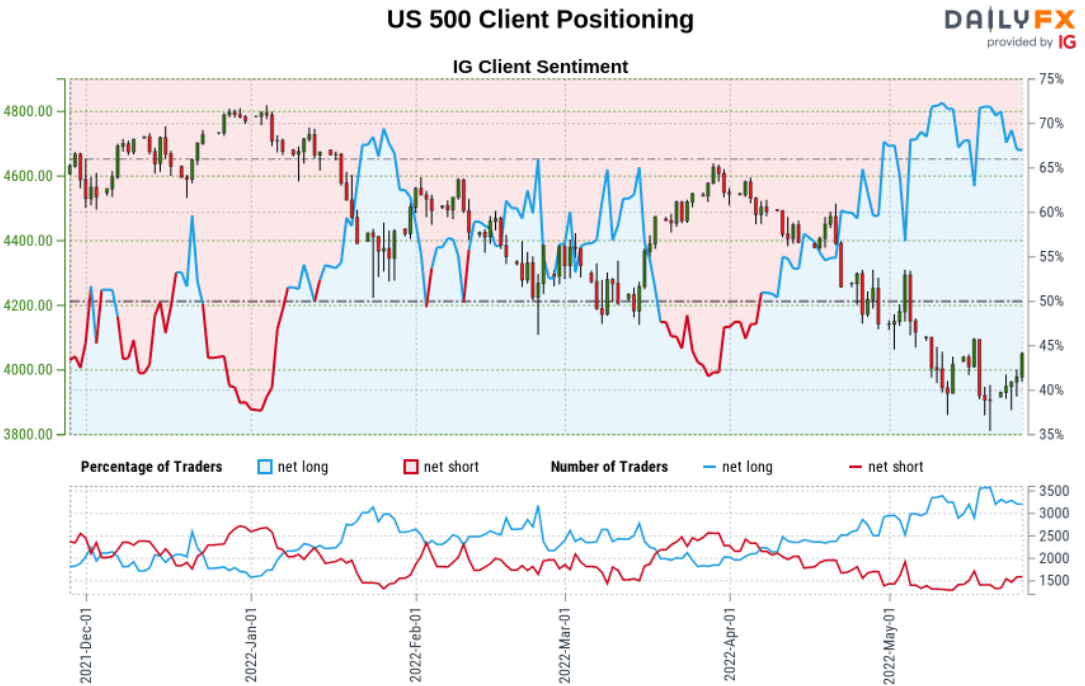
- A summary of IG Client Sentiment shows traders are net-long the S&P 500- the ratio stands at +1.87 (65.11% of traders are long) – typically a bearishreading
- Long positions are2.69% lower than yesterday and 8.12% lower from last week
- Short positions are 5.81% higher than yesterday and 13.52% higher from last week
- We typically take a contrarian view to crowd sentiment, and the fact traders are net-long suggests US 500 prices may continue to fall. Yet traders are less net-long than yesterday and compared with last week. Recent changes in sentiment warn that the current US 500 price trend may soon reverse higher despite the fact traders remain net-long.

Nasdaq 100 Price Chart – NDX Weekly
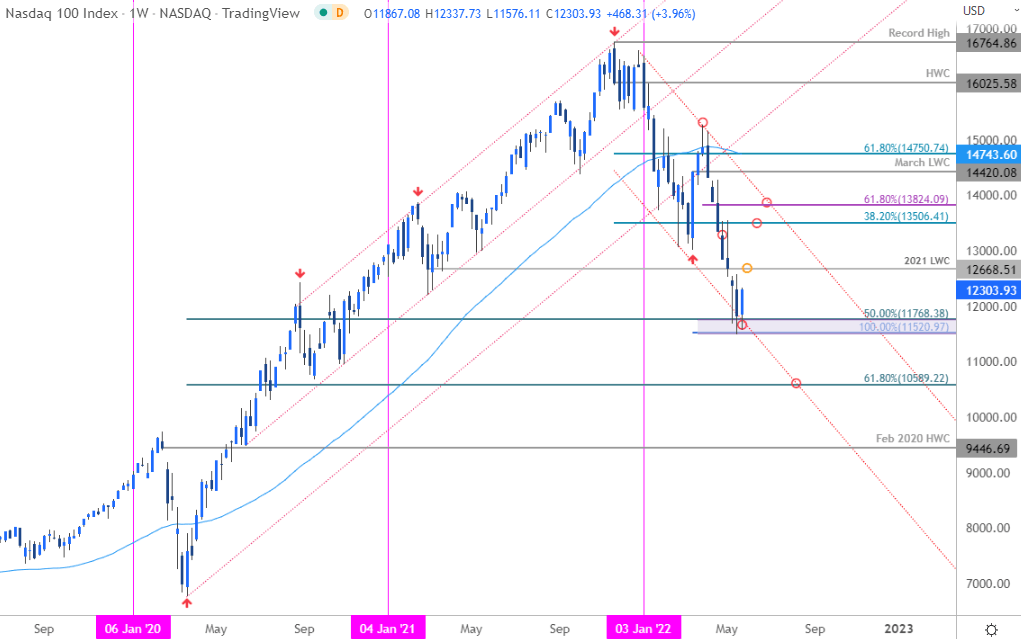
Chart Prepared by Michael Boutros, Technical Strategist; NDX on Tradingview
Notes:Last week we noted that, “The seven-week decline takes the Nasdaq into a key technical confluence at 11520/768- a region defined by the 100% extension of the yearly decline and the 50% retracement of the 2020 advance. Looking for possible price inflection here with a break / weekly close below needed to keep the immediate decline viable towards the 61.8% retracement at 10589.” The index registered a low at 11492 before rebounding with the focus now on this bear-market recovery.
Initial resistance steady at the 2021 low-week close (12668) backed by the 38.2% retracement of the late 2021 decline at 13506 and the key 61.8% retracement of the March decline at 13824- both zones of interest for possible topside exhaustion IF reached.
Bottom line: A rebound off downtrend support in the Nasdaq risks a recovery towards downtrend resistance. From a trading standpoint, look to reduce long-exposure / raise protective stops on a stretch towards the upper parallels.
Dow Jones Industrial Average Price Chart – US30 Weekly
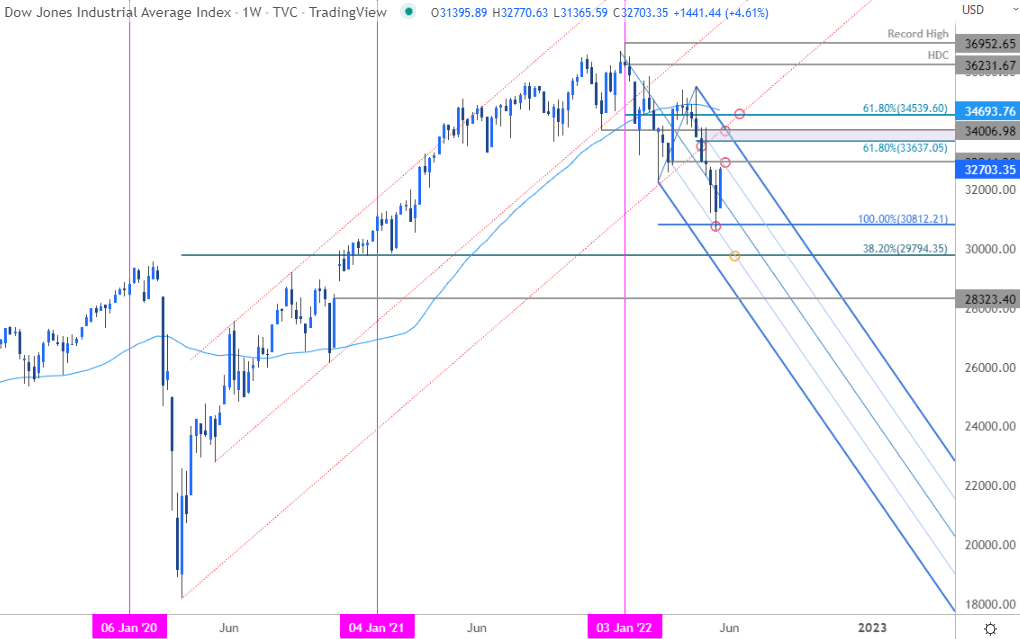
Chart Prepared by Michael Boutros, Technical Strategist; US30 on Tradingview
Notes: The focus last week was to be, “looking for a reaction on a drop into downtrend support at 30812 for guidance here.” The index briefly registered an intraweek low at 30635 before rebounding sharply with the rally now up more than 6.7% off the lows. Initial weekly resistance eyed at the March low-week close at 32944 backed by 33637-34006- an area of interest for possible topside exhaustion IF reached. Broader bearish invalidation now lowered to 34539.
Bottom Line: A rebound off confluent support at the 100% extension keeps the focus on this near-term recovery. From at trading standpoint, look to reduce long-exposure / raise protective stops on a stretch towards the upper parallels- look for a reaction there for guidance. A break of the lows would threaten a test of the 2021 lows / 38.2% retracement around ~29794.
For a complete breakdown of Michael’s trading strategy, review his Foundations of Technical Analysis series on Building a Trading Strategy
Active Weekly Technical Setups
- US Dollar Index (DXY)
- New Zealand Dollar (NZD/USD)
- Gold (XAU/USD)
- Crude Oil (WTI)
- Canadian Dollar (USD/CAD)
- British Pound (GBP/USD)
- Australian Dollar (AUD/USD)
- Euro (EUR/USD)
-Written by Michael Boutros, Technical Strategist with DailyFX
Follow Michaelon Twitter @MBForex


