


Canadian Dollar Technical Forecast: USD/CAD Weekly Trade Levels
- Canadian Dollar updated technical trade levels - Weekly Chart
- USD/CAD attempting fourth weekly-decline – uptrend support in focus into June open
- Support ~1.2546 (key), 1.2402, 1.2314 – Resistance 1.2814, 1.2975-1.3023 (key), 1.3230
The Canadian Dollar surged more than 1.0% against the US Dollar this week with USD/CAD plunging back towards technical uptrend support. The four-week sell-off takes price into a make-or-break range for the bulls and the battle lines are drawn heading into the June open. These are the updated targets and invalidation levels that matter on the USD/CAD weekly technical price chart. Review my latest Weekly Strategy Webinar for an in-depth breakdown of this Loonie technical setup and more.
Canadian Dollar Price Chart – USD/CAD Weekly
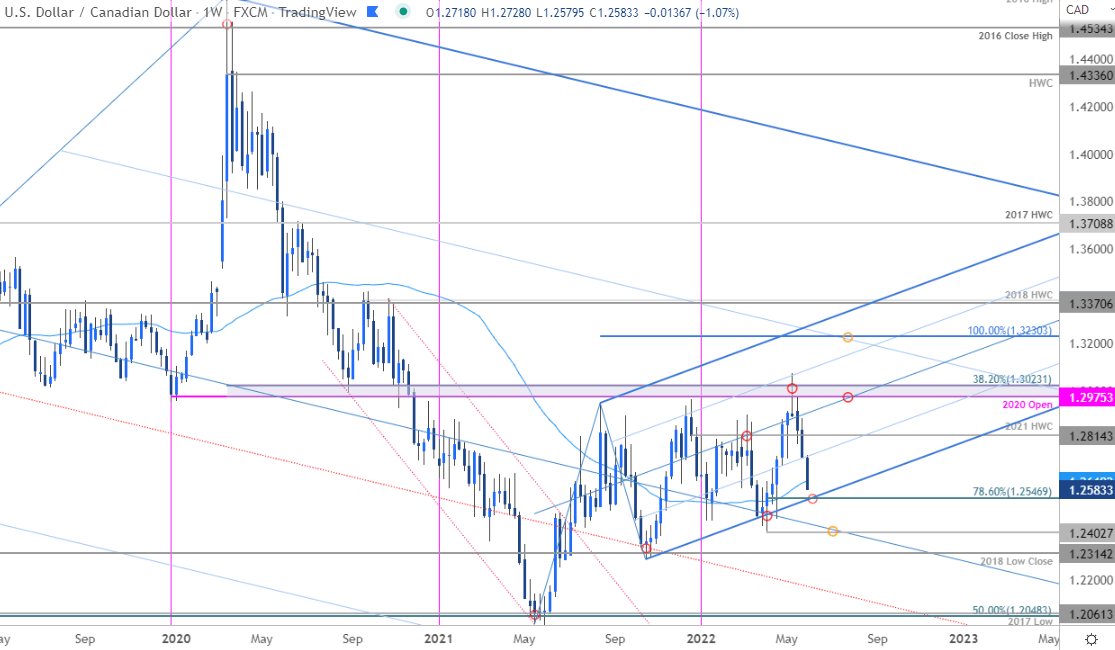
Chart Prepared by Michael Boutros, Technical Strategist; USD/CAD on Tradingview
Notes: In last month’s Canadian Dollar Weekly Technical Forecast we noted that the USD/CAD breakout had extended into resistance at a, “key inflection zone and we’re looking for a reaction here- watch the weekly close. From a trading standpoint, a good zone to reduce portions of long-exposure / raise protective stops.” USD/CAD registered an intra-week high at 1.3076 that week before pulling back to close well below key resistance at 1.2975-1.3023- a region defined by the 2020 yearly open and the 38.2% Fibonacci retracement of the 2020 decline. The subsequent reversal is now attempting a fourth weekly decline with the price now eyeing uptrend support around the 78.6% retracement at 1.2546- looking for a larger reaction there IF reached.
Initial weekly resistance eyed at the 2021 high-week close at 1.2814 with a breach / close above 1.3023 still needed to mark resumption of the broader 2021 uptrend towards the 100% extension at 1.3230. A break / weekly close below this ascending median-line formation would threaten a challenge of the yearly lows at 1.2402- a critical inflection zone to keep an eye on IF reached.

Bottom line: The USD/CAD reversal off uptrend resistance is now eyeing a drop into uptrend support- looking for possible price inflection a bit lower. From a trading standpoint, look to reduce short-exposure / lower protective stops on a stretch into 1.2546. Rallies should be capped by 1.28 IF price is moving lower with a break exposing a run to fresh yearly lows. Review my latest Canadian Dollar Price Outlook for a closer look at the near-term USD/CAD technical trade levels.
For a complete breakdown of Michael’s trading strategy, review his Foundations of Technical Analysis series on Building a Trading Strategy
Canadian Dollar Trader Sentiment – USD/CAD Price Chart
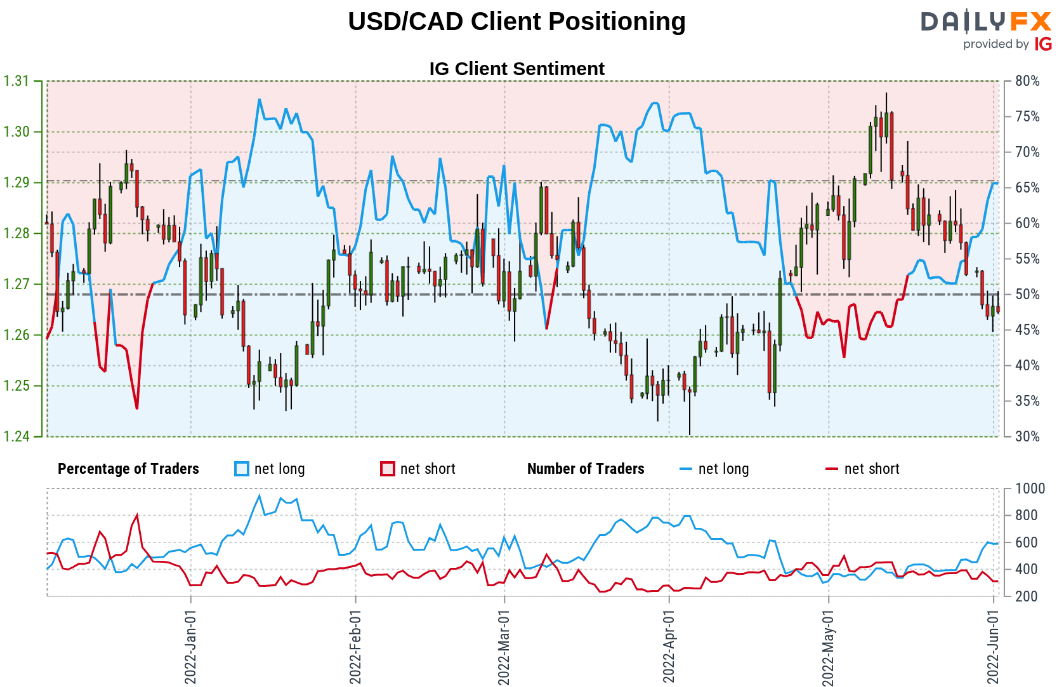
- A summary of IG Client Sentiment shows traders are net-long USD/CAD - the ratio stands at +1.93 (65.86% of traders are long) – typically bearish reading
- Long positions are0.64% higher than yesterday and 59.85% higher from last week
- Short positions are 6.09% lower than yesterday and 16.71% lower from last week
- We typically take a contrarian view to crowd sentiment, and the fact traders are net-long suggests USD/CAD prices may continue to fall. Traders are further net-long than yesterday and last week, and the combination of current positioning and recent changes gives us a stronger USD/CAD-bearish contrarian trading bias from a sentiment standpoint.
| Change in | Longs | Shorts | OI |
| Daily | 6% | -11% | -5% |
| Weekly | 12% | -18% | -8% |
US / Canada Economic Calendar

Economic Calendar - latest economic developments and upcoming event risk.
Active Weekly Technical Charts
- Australian Dollar (AUD/USD)
- Gold (XAU/USD)
- British Pound (GBP/USD)
- S&P 500, Nasdaq, Dow
- US Dollar Index (DXY)
- New Zealand Dollar (NZD/USD)
- Crude Oil (WTI)
--- Written by Michael Boutros, Technical Strategist with DailyFX
Follow Michael on Twitter @MBForex


