


Crude Oil Technical Forecast: WTI Weekly Trade Levels
- Crude Oil updated technical trade levels – Weekly Chart
- WTI price breakout attempting seventh weekly advance- Initial resistance targets in view
- New to Oil Trading? Get started with this Free How to Trade Oil-Beginners Guide
Crude oil prices surged for a seventh consecutive week with WTI rallying a staggering 32.5% off the April lows. The breakout keeps the focus on a march towards the yearly high with the advance now testing initial resistance targets. These are the updated targets and invalidation levels that matter on the oil price weekly technical chart. Review my latest Strategy Webinar for an in-depth breakdown of this crude oil price technical setup and more.
Crude Oil Price Chart – WTI Weekly
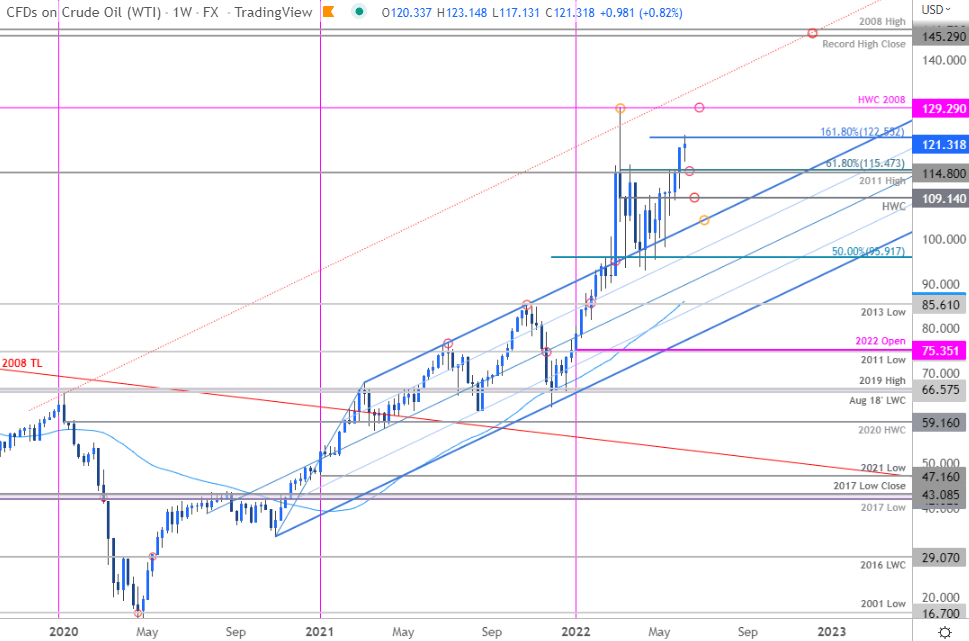
Chart Prepared by Michael Boutros, Technical Strategist; Crude Oil (WTI) on Tradingview
Notes: In last month’s Crude Oil Technical Forecast we noted that WTI was, “in contraction just above former slope resistance, now support. From a trading standpoint, the focus is on a breakout of this range for guidance…” A topside breach of the range into the close of June fueled a rally of more than 7% with WTI stretching into initial resistance this week at the 1.618% extension of the April advance at 122.55.
Initial weekly support now rests back at the 2011 high / 61.8% Fibonacci retracement of the March decline at 114.80-115.47 backed by the yearly high-week close at 109.14- losses should be limited to this threshold IF price is indeed heading higher on this stretch. Ultimately a close below former slope resistance (currently ~104) would be needed to invalidation the broader uptrend in crude.
A breach / close above this hurdle keeps the focus on subsequent resistance objectives at the 2008 high-week close / March high at 129.29/41, the upper parallel (currently near ~134) and the record high-close / 2008 high at 145.29-146.73- look for a larger reaction there IF reached.

Bottom line: The crude oil price breakout is testing initial resistance targets here. From at trading standpoint, a good zone to raise protective stops – look for downside exhaustion ahead of 109.14 on pullbacks with a breach / close above 122.55 needed to keep the immediate advance viable towards the yearly highs.
For a complete breakdown of Michael’s trading strategy, review his Foundations of Technical Analysis series on Building a Trading Strategy
Crude Oil Trader Sentiment – WTI Price Chart
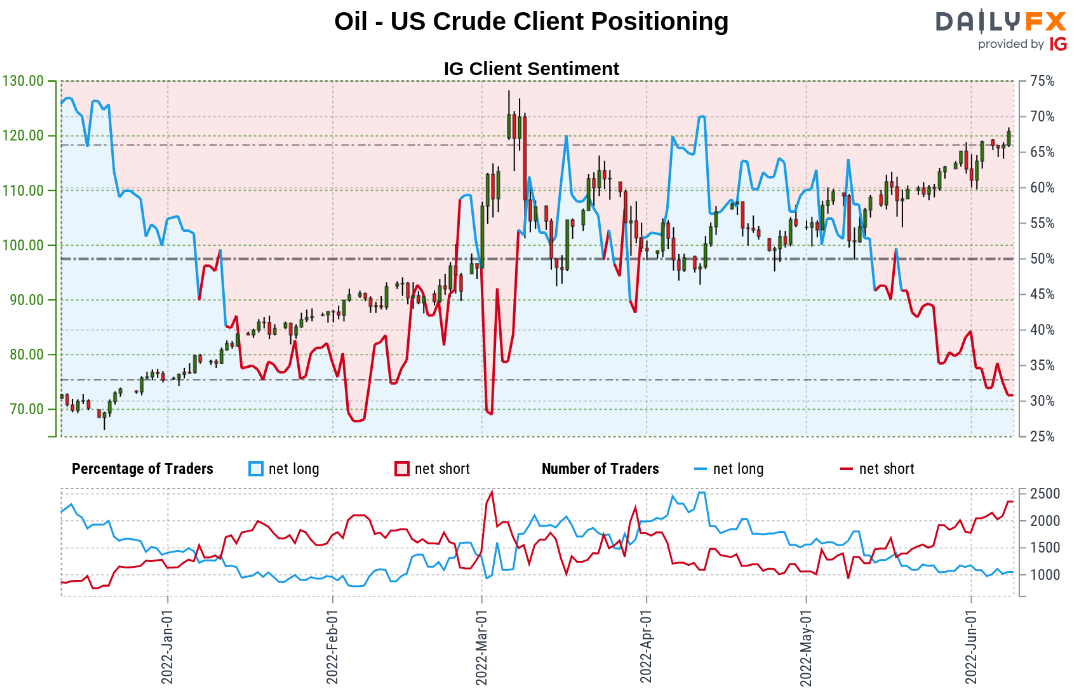
- A summary of IG Client Sentiment shows traders are net-short crude oil - the ratio stands at -2.06 (32.68% of traders are long) – typically bullishreading
- Long positions are5.41% lower than yesterday and 17.65% lower from last week
- Short positions are3.70% higher than yesterday and 35.73% higher from last week
- We typically take a contrarian view to crowd sentiment, and the fact traders are net-short suggests Oil - US Crude prices may continue to rise. Traders are further net-short than yesterday and last week, and the combination of current positioning and recent changes gives us a stronger Oil - US Crude-bullish contrarian trading bias from a sentiment standpoint.
| Change in | Longs | Shorts | OI |
| Daily | 3% | -7% | 1% |
| Weekly | 31% | -38% | 7% |
---
Active Weekly Technical Charts
- Japanese Yen (USD/JPY)
- Euro (EUR/USD)
- Canadian Dollar (USD/CAD)
- Australian Dollar (AUD/USD)
- Gold (XAU/USD)
- British Pound (GBP/USD)
- S&P 500, Nasdaq, Dow
- US Dollar Index (DXY)
- New Zealand Dollar (NZD/USD)

--- Written by Michael Boutros, Technical Strategist with DailyFX
Follow Michael on Twitter @MBForex


