


British Pound Technical Price Outlook: GBP/USD Weekly Trade Levels
- Sterling technical trade level update – Weekly Chart
- GBP/USD two-week rebound off uptrend support eyes initial resistance targets
- Weekly resistance 1.2650, 1.2754(key), 1.2956 – Support 1.2351, 1.2261(critical), 1.2166
A reversal off long-term uptrend support in the British Pound has fueled a rally of more than 4.1% off the yearly lows. The two-week rally takes GBP/USD into initial resistance with the a major technical confluence just higher- we’re on the lookout for possible topside exhaustion heading into the June open. These are the updated targets and invalidation levels that matter on the GBP/USD weekly chart. Review my latest Strategy Webinar for an in-depth breakdown of this Sterling technical setup and more.
British Pound Price Chart - GBP/USD Weekly
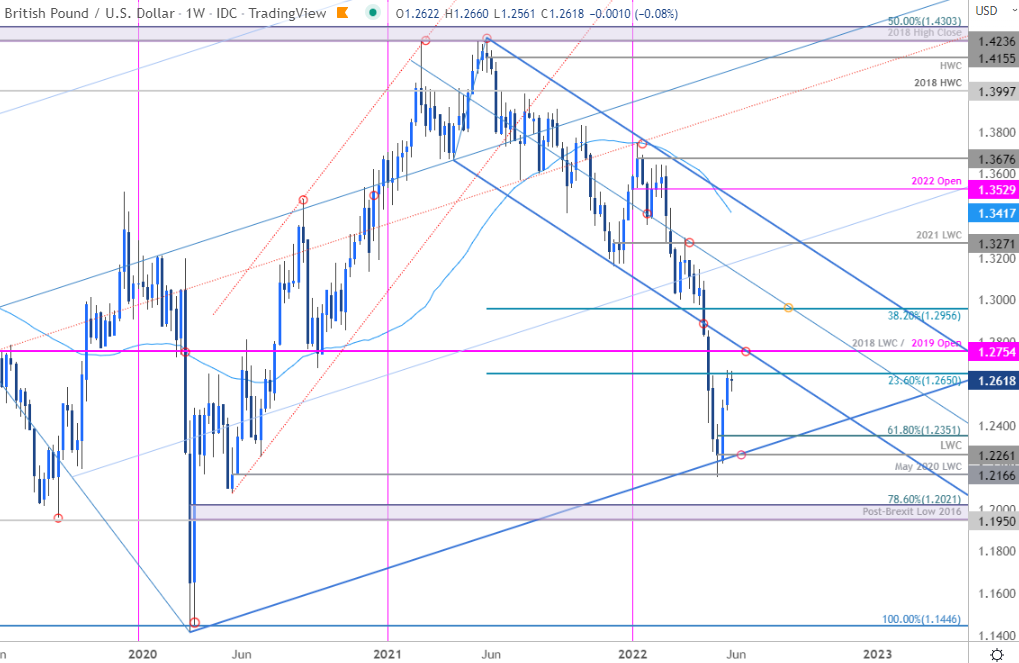
Chart Prepared by Michael Boutros, Technical Strategist; GBP/USD on Tradingview
Notes: In my last British PoundWeekly Technical Forecast we noted that the GBP/USD, “plunge may be vulnerable in the days ahead as a multi-week decline approaches longer-term technical support.” Specifically, “the June 2020 lows at 1.2252 and the May low-week close at 1.2166- both levels of interests for possible downside exhaustion IF reached.” Sterling registered a low at 1.2156 in the following days before reversing sharply higher with a two-week advance taking GBP/USD into the first level of resistance here at the 23.6% Fibonacci retracement of the 2021 decline at 1.2650.
A more significant resistance zone is eyed at the 2018 low-week close / 2019 yearly open at 1.2754- a breach / weekly close above this threshold would be needed to shift the focus towards the 38.2% retracement at 1.2956. Initial weekly support now 1.2351 with a break / weekly close below the yearly low-week close at 1.2261 needed to fuel the next leg lower in price towards 1.2166 and the next major technical confluence at 1.1950-1.2021.
For a complete breakdown of Michael’s trading strategy, review his Foundations of Technical Analysis series on Building a Trading Strategy
Bottom Line: The British Pound rebound may have further upside potential here but we’re on the lookout for possible price inflection on a stretch towards 1.2754 IF reached. From a trading standpoint, look for an exhaustion high heading into the June open – ultimately, losses should be governed by the yearly 1.2261 IF in fact a more significant low was registered this month. I’ll publish an updated Sterling Price Outlook once we get further clarity on the near-term GBP/USD technical trade levels. Stay tuned!

British Pound Trader Sentiment - GBP/USD Price Chart

- A summary of IG Client Sentiment shows traders are net-long GBP/USD - the ratio stands at +1.94 (65.95% of traders are long) – typically bearish reading
- Long positions are 0.23% lower than yesterday and 4.09% lower from last week
- Short positions are 4.73% higher than yesterday and 18.38% higher from last week
- We typically take a contrarian view to crowd sentiment, and the fact traders are net-long suggests GBP/USD prices may continue to fall. Yet traders are less net-long than yesterday and compared with last week. Recent changes in sentiment warn that the current GBP/USD price trend may soon reverse higher despite the fact traders remain net-long.
| Change in | Longs | Shorts | OI |
| Daily | 3% | -7% | -3% |
| Weekly | 4% | -10% | -5% |
UK / US Economic Calendar
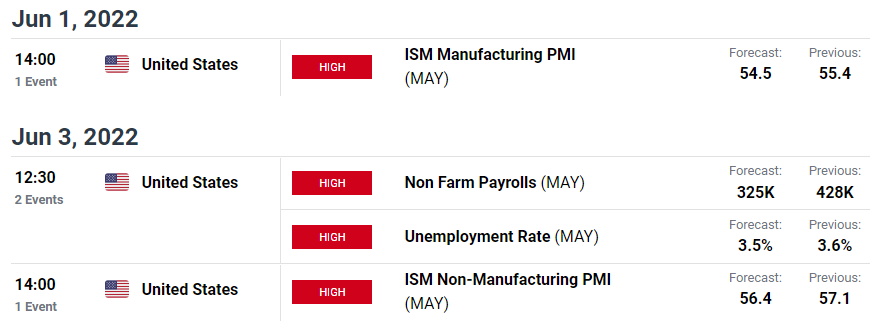
Economic Calendar - latest economic developments and upcoming event risk.
Active Weekly Technical Charts
- S&P 500, Nasdaq, Dow
- US Dollar Index (DXY)
- New Zealand Dollar (NZD/USD)
- Gold (XAU/USD)
- Crude Oil (WTI)
- Canadian Dollar (USD/CAD)
- Australian Dollar (AUD/USD)

--- Written by Michael Boutros, Technical Strategist with DailyFX
Follow Michael on Twitter @MBForex


