


US Dollar Technical Price Outlook: DXY Weekly Trade Levels
- US Dollar technical trade level update – Weekly Chart
- USD FOMC rally fuels second test of uptrend resistance- exhaustion risk
- DXY support 103, 101.87/94, 99.45 (key) – Resistance 104.88 (critical), 106.56, 108.09
The US Dollar Index is poised to close out a third consecutive weekly advance with DXY trading at 104.72 into the open of US trade on Friday. A rally to fresh multi-year highs on the heels of this week’s FOMC interest rate decision has faded with the greenback once again struggling to breach uptrend resistance. While the broader out remains constructive, the threat for exhaustion in the days ahead keeps the focus on a possible reset for the bulls and a pullback may offer more favorable opportunities closer to trend support. These are the updated technical targets and invalidation levels that matter on the US Dollar Index weekly price chart. Review my latest Strategy Webinar for an in-depth breakdown of thisDXY technical setup and more.
US Dollar Index Price Chart – DXY Weekly
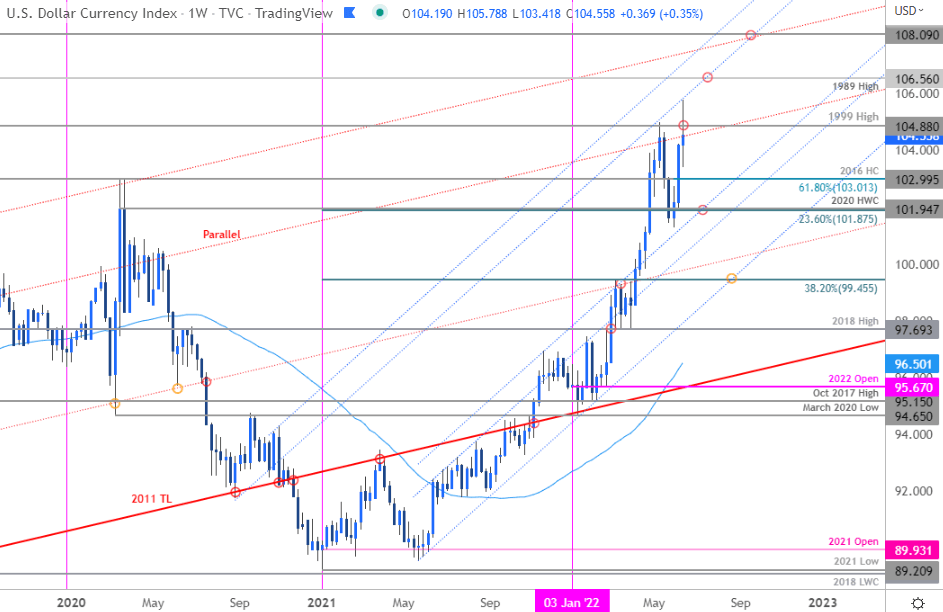
Chart Prepared by Michael Boutros, Technical Strategist; US Dollar Index on Tradingview
Notes: In last month’s US Dollar Weekly Price Outlook we noted that DXY had, “responded to uptrend resistance and while the broader trade remains constructive, the immediate advance may be vulnerable here near-term. From a trading standpoint, be on the lookout for downside exhaustion ahead of 101.80 IF price is indeed heading higher on this stretch with a breach / close above 104.88 needed to mark resumption of the broader uptrend.” The index briefly registered an intraweek low at 101.30 into the close of May before reversing sharply higher with the index failing another attempt to breach the 1999 high at 104.88 yet again this week. Note that the upslope derived off the 2021 / 2022 lows (blue) continues to govern the stretch highs here and highlights the threat for a near-term pullback off uptrend resistance.
Initial weekly support rest with the 61.8% Fibonacci retracement of the May rally / 2016 high-close at 103 backed by the 23.6% retracement of the 2021 rally / 2020 high-week close at 101.87/95. Broader bullish invalidation now raised to the 2021 trendline / 38.2% retracement at 99.45. A topside breach / close above 104.88 is needed to mark resumption with subsequent resistance objectives eyed at the 1989 high at 106.56 and the 2001 low 108.09.
For a complete breakdown of Michael’s trading strategy, review his Foundations of Technical Analysis series on Building a Trading Strategy
Bottom line: The US Dollar has responded to uptrend resistance for the second time on building momentum divergence and once again highlights the threat for near-term exhaustion in the index. From a trading standpoint, a good time to reduce portions of long-exposure / raise protective stops – losses should be limited to 101.87/95 IF the index is indeed heading higher on this stretch. I’ll publish and updated US Dollar Price Outlook once we get further clarity on the near-term DXY technical trade levels.

Active Weekly Technical Charts
- Australian Dollar (AUD/USD)
- Canadian Dollar (USD/CAD)
- S&P 500, Nasdaq, Dow
- Gold (XAU/USD)
- New Zealand Dollar (NZD/USD)
- Crude Oil (WTI)
- Japanese Yen (USD/JPY)
- Euro (EUR/USD)
- British Pound (GBP/USD)
--- Written by Michael Boutros, Technical Strategist with DailyFX
Follow Michael on Twitter @MBForex


