


S&P 500, Nasdaq & Dow Technical Price Forecast: Weekly Trade Levels
- S&P 500, Nasdaq & Dow technical trade level update – Weekly Charts
- SPX500 support 3665, 3482-3501, 3419- resistance 3906/08, 4139/96
- Nasdaq weekly range break in focus- support 10589, 9206/446- resistance 11768, 12208, 12668
- Dow testing support at 29794 (key), 28323, 27583/919- resistance 30812, 31392, 32272
The stock route continued this week the S&P 500 and the Nasdaq poised to close deep into a technical bear market. The Dow is just behind, down more than 19% to trade just above key confluent support. The battle lines are drawn heading into the last full week of June. These are the targets and invalidation levels that matter on the S&P 500 (SPX500), Nasdaq (NDX) and the Dow Jones Industrial Average (US30) weekly technical price charts. Review my latest Strategy Webinar for an in-depth breakdown of these technical stock setups and much more.
S&P 500 Price Chart – SPX500 Weekly
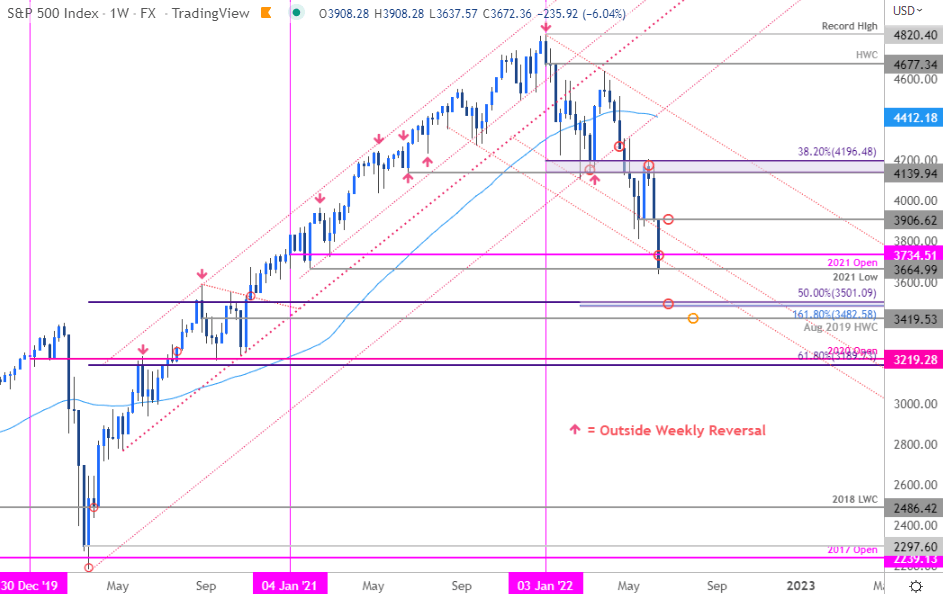
Chart Prepared by Michael Boutros, Technical Strategist; SPX500 on Tradingview
Technical Outlook: In my last S&P500 Weekly Technical Outlook we noted that the SPX500 was approaching key support targets at the 2021 yearly open at 3734 and “the 2021 yearly low just lower at 3665- a break / weekly close below this threshold could fuel another accelerated sell-off in the index…” The index is testing this level today and while the broader outlook does remain weighted to the downside, failure to close below would leave the immediate decline vulnerable here near-term.
Initial resistance now at 3906 backed by 4139/96- both levels of interest for possible topside exhaustion IF reached. A break lower from here keeps the focus on subsequent support objectives at the 1.618% extension / 50% retracement at 3482-3501 and the August 2019 high-week close at 3419.

Bottom line: A three-week decline takes the S&P 500 into support here at the 2021 lows- looking for possible near-term inflection here next week. Rallies should be capped by 3906 IF price is heading lower on this stretch with a close below 3665 still needed to mark resumption of the broader downtrend toward 3500. I’ll publish and updated S&P 500 Near-term Technical Outlook once we get further clarity on the near-term SPX500 technical trade levels.
S&P 500 Trader Sentiment – SPX500 Price Chart
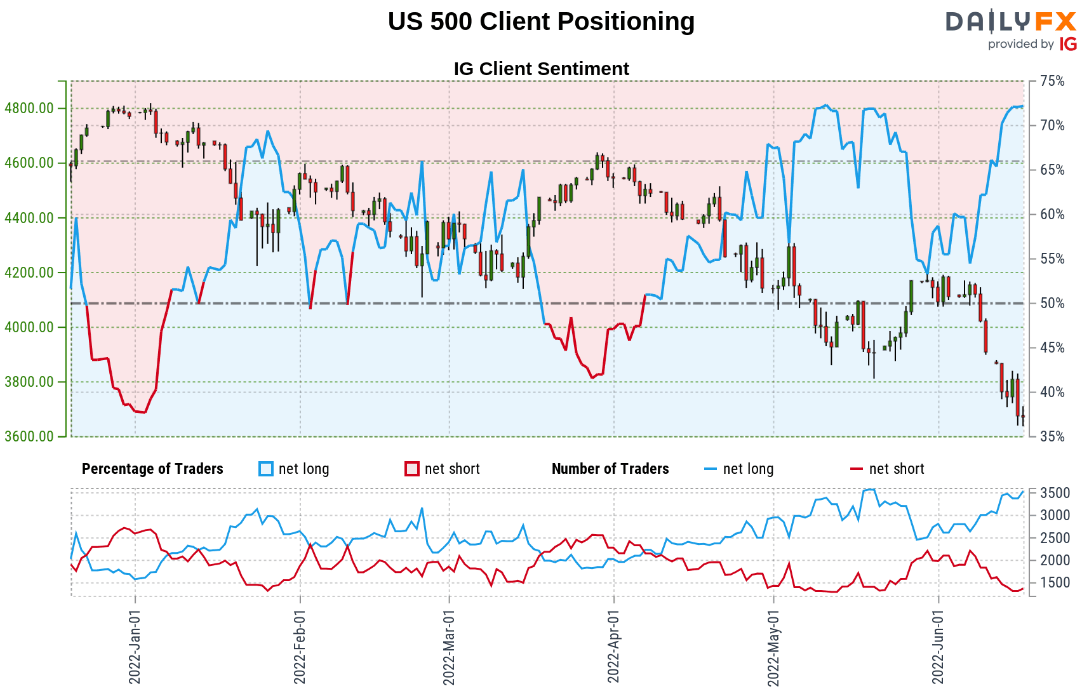
- A summary of IG Client Sentiment shows traders are net-long the S&P 500- the ratio stands at +2.31 (69.80% of traders are long) – typically a bearishreading
- Long positions are3.18% higher than yesterday and 16.97% higher from last week
- Short positions are 4.39% lower than yesterday and 23.48% lower from last week
- We typically take a contrarian view to crowd sentiment, and the fact traders are net-long suggests US 500 prices may continue to fall. Traders are further net-long than yesterday and last week, and the combination of current positioning and recent changes gives us a stronger S&P 500-bearish contrarian trading bias from a sentiment standpoint.

Nasdaq 100 Price Chart – NDX Weekly
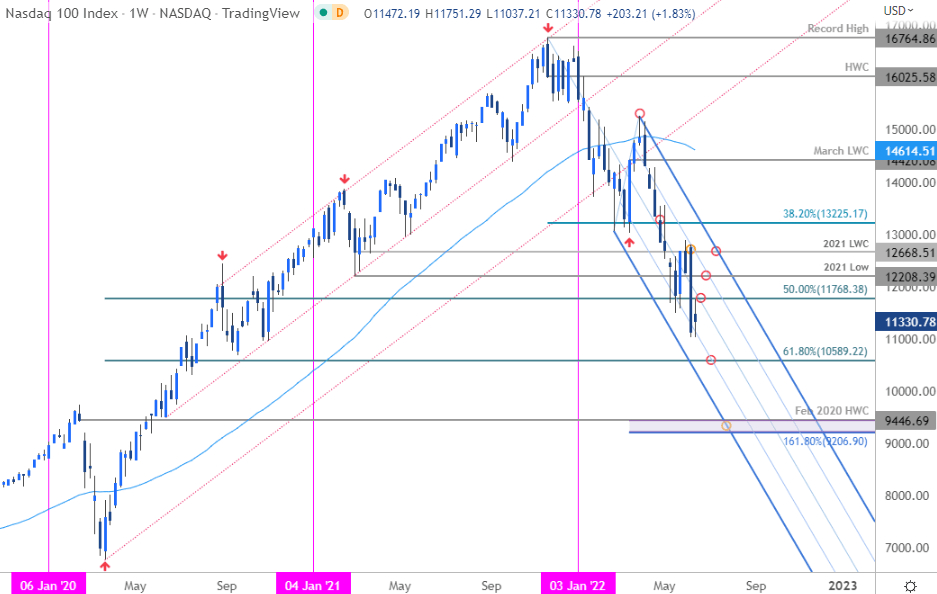
Chart Prepared by Michael Boutros, Technical Strategist; NDX on Tradingview
Notes: Into the start of the week we noted that, “The decline has been riding the 25% parallel of the descending pitchfork we’ve been tracking off the 2021 high and IF price is heading lower on this stretch, rallies should now be capped by 11768.” Price registered a high at 11751 this week before turning lower again but the focus remains on a breakout of this week’s range for guidance.
A break lower keeps the focus on major support targets at the 61.8% Fibonacci retracement of the 2021 advance at 10589 and the 1.618% extension / February 2020 high-week close at 9206-9446. Resistance steady at 11768 backed by the 2021 low at 12208 and broader bearish invalidation at the 2021 low-week close (12668).
Bottom line: A break below and test of the median-line as resistance does keep the bearish bias intact here but the immediate focus is on a breakout of this week’s range. From a trading standpoint the threat remains lower while below 12208 with a break / close below this week’s low needed to clear the way towards key Fibonacci support at 10589.
Dow Jones Industrial Average Price Chart – US30 Weekly
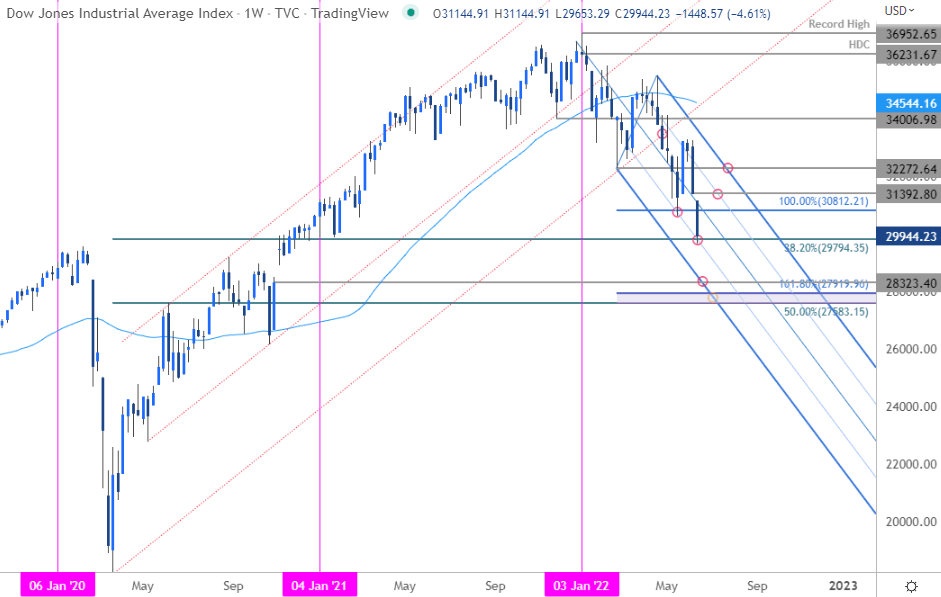
Chart Prepared by Michael Boutros, Technical Strategist; US30 on Tradingview
Notes: The Dow is testing confluent support into the close of the week at the 25% parallel / 38.2% retracement of the 2020 advance / 2021 low at 29794/856. We’re looking for a reaction / price inflection here.
A break / close below keeps the focus on the uncovered gap at 28323 and the next major confluent support at the 50% retracement / 1.618% ext at 27583/919. Initial resistance now 30812 backed by 31392- both levels of interest for possible topside exhaustion IF reached. Broader bearish invalidation now lowered to the February low at 32272.
Bottom Line: The Dow has dropped into a key technical confluence at downtrend support- risk for price inflection here. From a trading standpoint, rallies should be capped by 31392 IF price is heading lower on this stretch with a close below 29794 needed to fuel the next leg lower in price.
For a complete breakdown of Michael’s trading strategy, review his Foundations of Technical Analysis series on Building a Trading Strategy
Active Weekly Technical Setups
- US Dollar Index (DXY)
- Australian Dollar (AUD/USD)
- Canadian Dollar (USD/CAD)
- Gold (XAU/USD)
- New Zealand Dollar (NZD/USD)
- Crude Oil (WTI)
- Japanese Yen (USD/JPY)
- Euro (EUR/USD)
- British Pound (GBP/USD)
-Written by Michael Boutros, Technical Strategist with DailyFX
Follow Michaelon Twitter @MBForex


