


Gold Technical Price Forecast: XAU/USD Weekly Trade Levels
- Gold price updated technical trade levels - Weekly Chart
- XAU/USD attempting to mark third weekly sell-off – focus is on monthly / weekly close
- New to Gold Trading? Get started with this Free How to Trade Gold -Beginners Guide s
Gold prices plunged 0.5% this week with XAU/USD on pace for a third consecutive weekly sell-off into the close of June. The decline takes prices below a key support pivot we’ve been tracking for months now and the threat remains for a deeper correction towards longer-term uptrend support heading into the July / Q3 open. These are the updated targets and invalidation levels that matter on the XAU/USD weekly technical price chart. Review my latest Weekly Strategy Webinar for an in-depth breakdown of thisgold technical setup and more.
Gold Price Chart - XAU/USD Weekly
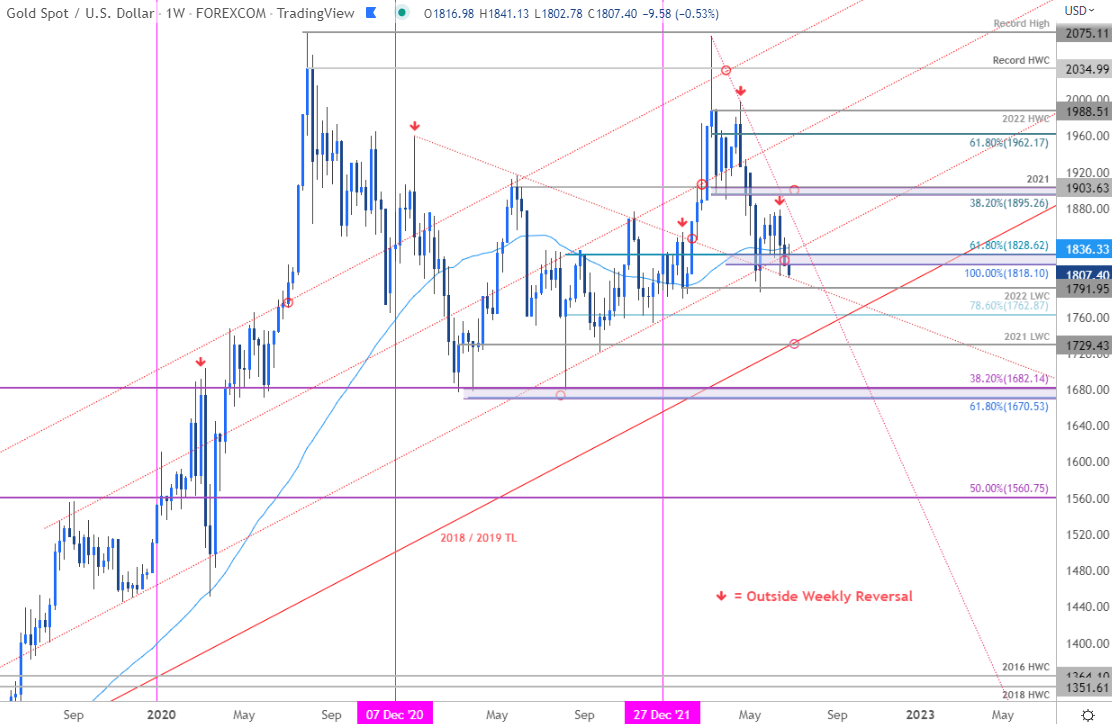
Chart Prepared by Michael Boutros, Technical Strategist; Gold on Tradingview
Notes: In my last Gold Weekly PriceOutlook we noted that XAU/USD had, “defended medium-term support at 1818/33 for a second time with an outside-weekly reversal off the lows (and an outside daily reversal on Friday) further defining this key threshold.” Gold is attempting to break below this key zone at the 100% extension of the yearly decline / 61.8% Fibonacci retracement of the 2021 rally yet again this week and the focus is on the monthly / weekly close with respect to 1818/33.
A downside break exposes the yearly low-week close at 1791 backed by the 78.6% retracement at 1762. Critical support rests with the 2021 low-week close which converges on the 2018 / 2019 trendline near 1729- we continue to reserve this threshold as our broader bullish invalidation level (area of interest for possible downside exhaustion IF reached. Initial weekly resistance now stands with the 52-week moving average (currently near 1836) backed by yearly trendline resistance (~1870s) with a breach / close above 1895-1903 needed to mark resumption of the broader multi-year uptrend in gold.

Bottom line: Gold is threatening a break below key technical support and the focus is on the monthly / weekly close with respect to 1818/28 for guidance. From a trading standpoint, a good zone to reduce short-exposure / lower protective stops heading into the close of the month. Ultimately, heading into the July open we’ll be on the lookout for a breakout of the 1791-1836 range for broader guidance with our focus on identifying a possible exhaustion low in Q3. Review my latest Gold Price Outlook for a closer look at the near-term XAU/USD technical trade levels.
For a complete breakdown of Michael’s trading strategy, review his Foundations of Technical Analysis series on Building a Trading Strategy
Gold Trader Sentiment – XAU/USD Price Chart

- A summary of IG Client Sentiment shows traders are net-long Gold- the ratio stands at +6.22 (86.15% of traders are long) – typically bearishreading
- Long positions are1.15% higher than yesterday and 10.64% higher from last week
- Short positions are 8.09% lower than yesterday and 20.81% lower from last week
- We typically take a contrarian view to crowd sentiment, and the fact traders are net-long suggests Gold prices may continue to fall. Traders are further net-long than yesterday and last week, and the combination of current positioning and recent changes gives us a stronger Gold-bearish contrarian trading bias from a sentiment standpoint.
| Change in | Longs | Shorts | OI |
| Daily | 1% | -3% | -1% |
| Weekly | 2% | -8% | -2% |
---
Active Weekly Technical Charts
- S&P 500, Nasdaq, Dow
- US Dollar Index (DXY)
- Australian Dollar (AUD/USD)
- Canadian Dollar (USD/CAD)
- New Zealand Dollar (NZD/USD)
- Crude Oil (WTI)
- Japanese Yen (USD/JPY)
- Euro (EUR/USD)
- Written by Michael Boutros, Technical Strategist with DailyFX
Follow Michael on Twitter @MBForex


